Economy
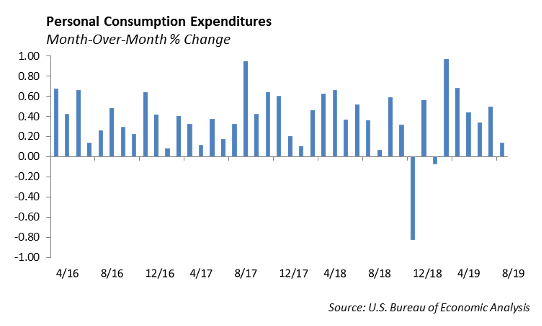
Data released last week for the U.S. economy showed further signs of a slowdown. Consumer spending, measured by Personal Consumption Expenditures, increased by 0.1% in August from the prior month, according to the Commerce Department. Consumer spending has been a strength in the economic recovery and has averaged roughly 0.5% growth over the past seven months. However, the sharp drop, which includes the back-to-school spending, portends potential consumer weakness heading into the holiday shopping season.
In addition, orders for long-lasting equipment and machinery, which is a proxy for business investment, declined -0.2% in August from the prior month. Our sense, heading into the quarterly earnings season, is companies are taking steps to protect profit margins in order to support slowing earnings growth. As a result, capital expenditures, fixed investment, and head count will be scrutinized. The risk in earnings is likely to the downside given current equity market valuations.
Monetary Policy
The repo market continues to show signs of dysfunction as the Federal Reserve in New York has intervened to suppress rates on short term loans known as repurchase agreements. Repo rates increased expectantly in mid-September as tax payments hit, large deposits transferred from the banks to the government, a decline in bank reserves as the Fed shrinks its balance sheet, coincided with a large amount of new issuance in the bond market.
In effect, banks would rather have kept cash on their balance sheet than earn up to 10% in the overnight repo market. As we learn more about why this happening, it points to structural problems in the capital markets.
Equities
The S&P was down 1% last week, ending at 2961. It is up 18% YTD and 2.2% away from all-time highs. Trade and impeachment talks were the headlines most of the week, which led to many day to day swings. Trump claimed that a deal could happen sooner than expected, resulting in a very positive market reaction. Then, a report stated that the US was unlikely to continue granting waivers for US companies to work with Huawei. Talks will resume next month. Additionally, Nancy Pelosi announced a formal impeachment inquiry based on Trump’s call with Ukraine’s President.
From a sector perspective, Energy and Financials were the top performers this month, both returning close to 7%, while Healthcare was the only sector negative, down 13bps. Year-to-date, Info Tech is still the top performer, returning 28.5%, while Health Care and Energy have each returned only 3% for the year.
Earnings estimates have decreased for the third quarter, with S&P companies expected to report a decline in earnings of -3.8% with growth of revenues of 2.8%.
- Nike Inc.: Revenue increased to $10.7 Billion, up 7%. Earnings per share for the quarter was $0.86, an increase of 28% and a beat by 16 cents. Gross margin was up 150 basis points to 45.7%. In North America, revenue grew by 4%, in Europe by 6%, in China by 27%, and in Asia by 6%. Footwear revenue was up 11%, apparel was up 9%, and equipment was up 11%. The stock hit all-time highs on earnings, up 5.2% to $92.31. Online sales were up 42%, and Nike’s women business grew in the double digits again.
- Micron Technology: MU fell 11% after its earnings. It did beat on estimates, however, with earnings of 56 cents beating estimates by 8 cents a share and revenue of $4.87 Billion beating estimates by 300 million. YoY, earnings are down 86%, and revenues are down 42% from 2018 levels. The guidance for 2020 was not great. Management warned that sales in Q1 will be $5 Billion with earnings of 46 cents per share, which missed expectations.
- Earnings for the week: Constellation Brands, Pepsi are Thursday and Costco is Thursday after the close.
In IPO news, the story of the week was Peloton, which opened at $27 and ended the week down 13%, posting an 11% drop on its first day of trading. The Renaissance IPO Index is still outperforming the S&P with a 24% YTD return; however, it has lost quite a bit of ground over the last 2 months, falling 15% since July. Demand seems to have declined since the first half of the year.
Fixed Income
Fixed income markets were relatively quiet over the past week, and rates were essentially left unchanged. The 10-year US Treasury ended the week at 1.68%, and curves remained positively sloping. Economic data was mixed over the week, but the stand out number was a rebound in new home sales, which are running at an annualized pace of 713,000. The sales uptick can be attributed to lower mortgage rates. 30-year mortgages are currently at 3.74%.
Investment grade spreads did widen over the week, following the downward trend of equity markets. The risk off trade was primarily driven by political headwinds and a continued underperformance of the energy sector. We continue to believe that we are in the early innings of market volatility as several domestic and geopolitical events seem to be converging at once. We are actively taking risk out of portfolios to weather the storm inevitably in front of us.
We ultimately still like corporate credit and will use market dislocations to add to our credit exposure. The driving theme for 2020 is a continued tightening of credit spreads in both the investment grade and high yield bond market as negative rates remain across the globe. Negative rates alone will not drive demand for US credit; however, hedging costs have declined over the past year, making the cross-continental trade more feasible for both European and Japanese investors. Hedging cost from Euro’s to Dollars has declined from 3.4% to 2.6% this year. While our rates are still historically low, at current hedging costs it makes sense for many overseas investors to buy US credit, especially high yield, and still have a suitable return. We believe this dynamic will drive both rates and spreads tighter over the near term.
Municipals
Despite a heavy week ($8 Billion in new issuance) municipals outperformed both treasuries and corporate credit over the week. 30-year muni’s remain at parity with US Treasuries. We continue to see a shift in holders as the holding of muni’s for banks has steadily declined since the Trump tax reform. However, mutual fund/retail holdings of municipals are on the rise. We do not see this theme changing anytime soon. We have maintained that the aging population will be the largest demand driver for municipal bonds. We still see the most value in 5-10 year munis, where yields relative to treasuries are at two-year wides, without putting on duration risk in the 30-year part of the curve.
High Yield
U.S. high yield credit moved wider for the first time since mid-August. Option-adjusted spread widened 18 basis points last week to just under 400 basis points. The high yield market is still sitting more than 130 bps tight of year end 2018. In regards to total return, the index declined 0.34%, with quality making its return to outperformance. Bs saw 58 bps of negative total return, which was surprisingly worse than CCCs at 49 bps of negative performance. BBs were only down 11 bps of total return. Year-to-date, the index as a whole has returned more than 11.50%, with BBs leading at just below 13% total return.
High yield fund flows returned to its back and forth nature, with modest outflows of $258 million leaving ETFs and mutual funds. This is an offset to the nearly $5 billion of inflows from the last two weeks.
The primary market remained relatively active last week with another $4 billion coming to market and pricing. As we close this month, we have seen $29 billion of new issuance, making this September the biggest monthly total of high yield new issuance in 2019. The market continues to pace above 2018 levels, beating 2018 by 29% over the last year respective period. New issuance was a mixed bag last week, with lower quality and smaller index names coming to market. Higher quality names, such as Beacon Roofing, saw strong order books and company favorable pricing, while lower quality names, such as Shutterfly, saw some investor pushback on pricing levels.
Similar to investment grade credits and interest rates, trade tension and political noise remain the name of the game for performance in high yield. We attribute much of the negative performance in high yield last week to those reasons; however, we cannot ignore the sharp selloff that happened in Q4 2018. We believe investors are taking that into account and beginning to de-risk a bit earlier heading into the fourth quarter. We are de-risking high yield portfolios going up into the BBB space. Our idea is augmented by current BB vs. BBB spread levels. BBBs currently have an OAS of 147 bps, while BBs currently are trading at an OAS of 220, with a spread difference of less than 75 bps, we believe the defense outweighs the spread given up. If nothing else, we believe this will provide plenty of ammunition to go back into high yield at wider levels in November and December if investors can fight the lack of liquidity often attributed to the holiday season.
Portfolio Models
Equity prices are near peak valuation, volatility is low, implied volatility is low, and credit spreads are tight. We expect that we are outside of risk/reward boundaries, which makes us cautious on risk assets. Earnings season picks up in two weeks. We are continuing to take several steps to reduce risk in our asset allocation and Portfolio Models heading into the fourth quarter. Domestic equity remains the largest exposure to the equity basis. We are shifting a portion of the broad market equity strategies into low volatility and adding large cap value.
International stocks, measured by the MSCI, have lagged domestic equity, measured by the S&P 500 through this year. We expect to maintain the current international equity allocation; however, if valuations warrant, we will increase exposure to international equity heading into the end of the year.
We are increasing exposure to liquid alternatives in our Tactical Allocation Models. We are evaluating a potential increase in exposure to global macro and multi-strategy funds. The challenge in the liquid alts universe is identifying funds with good performance, high sharpe ratios, and low fees. We are adding the Blackrock Total Factor Fund to our Tactical Allocation Models.
This report is published solely for informational purposes and is not to be construed as specific tax, legal or investment advice. Views should not be considered a recommendation to buy or sell nor should they be relied upon as investment advice. It does not constitute a personal recommendation or take into account the particular investment objectives, financial situations, or needs of individual investors. Information contained in this report is current as of the date of publication and has been obtained from third party sources believed to be reliable. WCM does not warrant or make any representation regarding the use or results of the information contained herein in terms of its correctness, accuracy, timeliness, reliability, or otherwise, and does not accept any responsibility for any loss or damage that results from its use. You should assume that Winthrop Capital Management has a financial interest in one or more of the positions discussed. Past performance is not a guide to future performance, future returns are not guaranteed, and a loss of original capital may occur. Winthrop Capital Management has no obligation to provide recipients hereof with updates or changes to such data.