Economic Update
So much has changed since the beginning of 2020, affecting the economy in many ways. We are living through challenging times that are stretching our understanding of economics and capital markets. Below, we have organized our thoughts to help illustrate the issues facing investors:
- The COVID-19 pandemic has decimated the economy. First quarter GDP was down -5.0% according to the Bureau of Economic Analysis, while second quarter GDP was down -31.7%. While we expect a rebound in economic growth in the third quarter, we believe the economy requires support in order to avoid another collapse.
- Large parts of the economy are still shutdown or operating with significant excess capacity. The entertainment, gaming, leisure, higher education, and travel related industries continue to face challenges to recovery.
- Temporarily unemployed workers are becoming permanent. While unemployment dropped from 10.2% to 8.4% last month, there are still nearly 12.0 million people out of work since March and two million workers that have permanently lost their jobs. We expect unemployment numbers to begin to trend higher as more fragile businesses shut down and corporations rationalize reducing headcount to contain costs heading into the end of the year.
- We do not expect the economy to fully recover to pre-pandemic levels until 2023, assuming there is an effective way to control the spread of the virus over the next six to twelve months.
- Congress has not agreed on an additional stimulus package. The initiative for additional fiscal stimulus has petered out ahead of the election. In the absence of additional fiscal stimulus, we expect consumer spending to slow in the fourth quarter.
- We expect the election in November to impact capital markets. There is a potential for an increase in equity market volatility and widening in credit spreads.
- Parts of the economy are experiencing financial deterioration. The fiscal health of certain cities and states are deteriorating. Because of the lag that municipalities have in releasing financial statements, we will not recognize the deterioration until mid-2021 in many cases. According to the National League of Cities, cities anticipate an average decline of -13% in fiscal year 2021 general fund revenues compared to fiscal year 2020. Nearly 90% of cities in the United States will be less able to meet the fiscal needs of their communities in fiscal year 2021 compared to the prior fiscal year.
- An increased number of companies are seeking protection from creditors through bankruptcy. Retailers such as Brooks Brothers, Neiman Marcus and JC Penny have filed for chapter 11, as well as other companies, including CMX Cinema and Golds Gym. The shift in credit quality will put pressure on the balance sheets of banks and insurance companies.
- The health of the financial system is strong. We expect nonperforming loans to increase in 2020. The banks have adequate capital to weather the storm. Additionally, the Fed has put limitations on the bank’s ability to repurchase their stock.
- Residential real estate appears to remain strong so far. Average home prices increased 10.1% over the past year, according to Realtor.com®. Credit card balances have declined since mid-March, underscoring the success of the federal assistance programs for consumers.
- The current structure of the economy is characterized by excess capacity. There is excess labor. Excess manufacturing capacity, and excess productivity. Capacity utilization is at a meager 70.5%. We do not expect sustained acceleration in the rate of inflation at this point.
- The rapid accumulation of debt will put pressure on the rating of the U.S. government debt. With a its current spending initiative, a budget deficit near $3 trillion and a debt to GDP ratio near 100%, the debt rating of the U.S. government is at a risk of being downgraded to AA.
Monetary Policy
The Federal Reserve is operating under a huge experiment in monetary policy that has never before been executed. Known as “quantitative easing,” this is a shift to a new monetary regime in which the central bank uses its balance sheet to purchase securities in the open market, altering the level of interest rates and the price of credit.
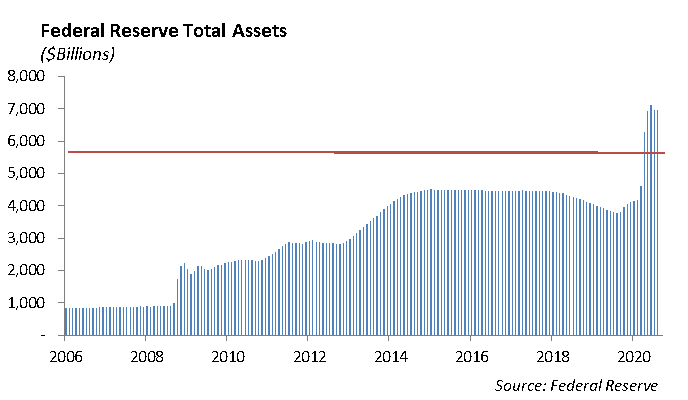
The Fed increased the size of its balance sheet assets from $4.3 trillion in mid-March to roughly $7 trillion by August. The size of the balance sheet is roughly 35% of GDP, which is the highest level it has reached since World War II.
The most significant change in the balance sheet was the increase of $2.36 trillion in government and agency securities since mid-March. The more interesting aspect of the program was the addition of the $44 billion in corporate bonds purchases under the Corporate Credit Facility LLC. While these changes are mostly symbolic at this point, the Fed’s ability to purchase corporate bonds in the open market under this program is effectively a subsidy to lenders.
Capital Markets
The borrowing binge that followed the pandemic and allowed companies has increased the number of zombie companies that are not able to produce cash flow to service their debt.
Equity
The S&P 500 was down -2.51% last week, bringing the total return to 3.41% year-to-date. The NASDAQ also had 2 straight weeks of decline, falling -4% last week. Year-to-date, the NASDAQ index is now up 21%. The large cap companies within the index, which have been some of the strongest performers this year, were the biggest source of declines this past week, including Apple, Microsoft, Amazon, and Google. By contribution to return, these stocks combined have had a greater negative impact towards NASDAQ performance over the past week than all other stocks combined.
In earnings for the week, Oracle and Peloton continued to show solid results:
Oracle Corporation (ORCL)
Oracle reported earnings of 93 cents per share versus 86 cents per share, and revenue of $9.37 billion versus $9.19 billion. Revenue grew 2% year over year. Cloud Services revenue came in at $6.95 billion, above consensus. The cloud license revenue was $886 million, up 9% and above estimates. Second quarter guidance is $1.00 at the midpoint with revenue growth of 1-3%. Shares were up 4% on release and are up about 8% year to date. Oracle is the lead company to acquire the U.S. operations of TikTok from ByteDance.
Peloton Interactive Inc (PTON)
Peloton reported earnings per share of 27 cents versus 10 cents expected. Revenue was $607 million versus $582 million. That is up 172% year over year. It ended the quarter with 1.09 million fitness subscribers, up 113% year over year, and 3.1 million members in total. Fitness subscribers pay $39/month instead of the regular $13/month. Guidance was also very strong. PTON expects first quarter sales to be $720 million, which would be a 218% growth year over year and over the $500 million expected. For 2021 sales, they expect $3.5 billion versus $2.7 billion. Stock prices were up 10% on release of earnings. In addition, Peloton announced an expanded product line extension.
Fixed Income
Fixed income markets were driven by primary issuance and treasury auctions over the week. Corporate issuance topped $68 billion over 46 deals, putting total investment grade corporate issuance at $1.45 trillion so far in 2020. While concessions over secondary bonds have remained tight, according to Bloomberg, 70% of newly issued bonds tightened once they began trading in secondary markets. Conversely, overall corporate spreads were unchanged through the week. This is consistent with the dramatic decline in volatility in the credit markets since March.
The Treasury also issued a large amount of bills, notes and bonds across the curve last week. $108 billion of bonds across 3-year and 10-year bonds were issued with a somewhat weak showing by primary dealers. $139 billion of short-term bills were also issued. Longer term issuance is expected to be light over the next few weeks and should provide some relief for interest rates. If equity volatility remains high while treasury supply remains low, we will likely see downward pressure on rates near term.
Spreads in the municipal bond market continue to trade tight, particularly on the short end of the yield curve. Municipals bonds rated AAA and with maturities shorter than three years are trading at similar levels to US Treasuries, with the 3-year municipal bond curve at 0.16%. At the same time, yields on 10-year municipal bonds have remained at a slight premium to US Treasuries since March’s market dislocation. Over the past six months, the relationship of municipals to high quality corporate bonds has remained consistent.
We expect credit deterioration in the municipal market over the next year as a result of the decline in tax revenues for municipalities to service debt. As we approach the election and navigate the ongoing fallout from COVID-19, we still believe high quality general obligation and essential service revenue bonds can provide low volatility defensive income into higher tax bracket investors.
This report is published solely for informational purposes and is not to be construed as specific tax, legal or investment advice. Views should not be considered a recommendation to buy or sell nor should they be relied upon as investment advice. It does not constitute a personal recommendation or take into account the particular investment objectives, financial situations, or needs of individual investors. Information contained in this report is current as of the date of publication and has been obtained from third party sources believed to be reliable. WCM does not warrant or make any representation regarding the use or results of the information contained herein in terms of its correctness, accuracy, timeliness, reliability, or otherwise, and does not accept any responsibility for any loss or damage that results from its use. You should assume that Winthrop Capital Management has a financial interest in one or more of the positions discussed. Past performance is not a guide to future performance, future returns are not guaranteed, and a loss of original capital may occur. Winthrop Capital Management has no obligation to provide recipients hereof with updates or changes to such data.
© 2020 Winthrop Capital Management