The Economy
“Education is what remains after one has forgotten what one has learned in school.” –Albert Einstein
There are so many things that we learned in business school that seemingly no longer apply to “the Great Experiment” we are currently experiencing in the global economy and capital markets. Like every other modern central bank around the globe, the Federal Reserve still facilitates providing credit to the capital markets through the banking system. However, it provides liquidity through different tools and at a size that is significantly larger than prior decades. The Federal Reserve continues to purchase assets in an effort to stimulate economic growth and inflation. But, growth is slow and inflation is barely hitting the 2% target. Since the Financial Crisis, the Fed has provided aggressive stimulus into the system in an effort to spur business investment and consumption.
This is the longest economic recovery since World War II, and it is also the weakest recovery. GDP growth never exceeds 3% in any calendar year since the recovery began in June of 2009. It is also the most expensive. It took our country over 230 years to accumulate $8 Trillion in total Federal Debt in 2008. It took only 11 more years to accumulate an additional $14 Trillion in debt. Where is the money going?
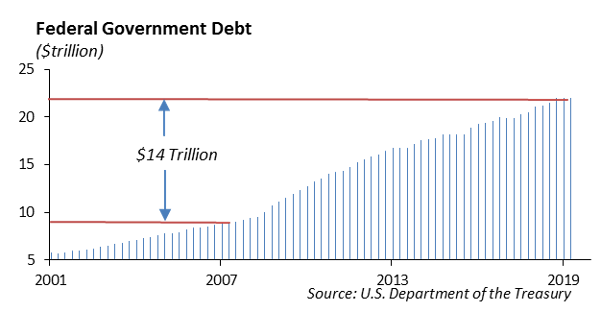
The money goes to fuel investments in stocks, bonds, real estate, private equity, venture capital. In addition, the money goes to fund government agencies, and entitlement programs. The Federal Reserve continues to provide money into the financial system to incentivize lending to investors at historically low interest rates. In parts of the world, money is even provided at negative interest rates which means the borrower effectively doesn’t get all of their principal back.
The slow growth recovery has been marked by a low level of investment and lack of an increase in productivity. This is evident in the increase in savings and investment, and the slower pace of spending on fixed investment. As a result, prices of financial assets, including stocks and bonds, have appreciated significantly, while economic growth and inflation remain persistently low.
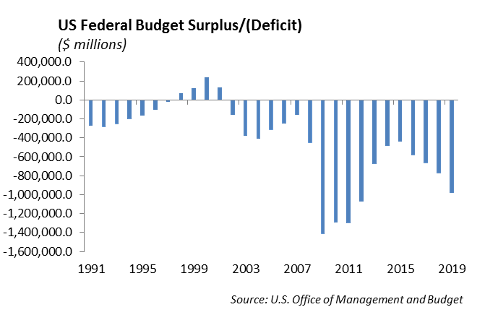
It is not unusual for a government to run a small budget deficit to support economic growth. The last budget surplus our government mustered together was in 1997 – 2000 under President Clinton. However, since the Financial Crisis, we have consistently run budget deficits of $1 trillion. A government desires to run a surplus during an economic expansion. It is insane to think that we are seeing the best that the economy is going to offer, and the budget for next year has a $1 trillion deficit. Who buys this debt and where does the money come from?
More debt is coming in 2020. Government debt, corporate debt, private debt, student loan debt, leveraged loans, you can pick your poison. The growth in debt far outpaces the growth in our economy. It is nearly impossible to exercise fiscal discipline now because any increase in interest rates to calibrate expected growth would likely kill the economy because the leverage is so pervasive in the system. As a result, our central bank will likely become the buyer. Just as the ECB reignited its quantitative easing program, we expect the Fed will be forced to restart QE.
Aggressive monetary policy is driving prices in financial assets higher. However, given current valuations in publicly traded financial assets, we are expecting compressed returns over the next several years. This will put pressure on portfolio returns for pension funds, IRAs, 401-k plans, insurance companies, and any other asset pool that funds a future liability stream.
In addition, healthcare funding will experience similar pressure as expected returns on financial assets will likely be insufficient to fund healthcare obligations. The healthcare system is funded on an annual “pay as you go basis,” and because of the aging population, there are fewer people paying into the system, which in turn, is supporting a larger and growing population of aging baby boomers.
The answer to America’s problems continues to be the path of least resistance – print more money.
Monetary Policy
The Federal Reserve Chairman Jerome Powell will testify before Congress Wednesday, November 13th. Powell has been fairly upbeat about the state of the economy, and we expect his testimony to reflect the same messaging following the last rate cut at the end of October. Last week, Powell described the U.S. economy as still in a “good place” and says he sees sustained expansion as the most likely outcome, “but uncertainties about this outlook remain.”
The Fed has given some light attention to the geo-political risks to domestic economic growth, which include the trade war with China, Brexit, and the uncertainty in the Middle East. Each of these are critical on their own, and a combination of negative surprises from any of these would negatively impact the current economic glide path.
Equities
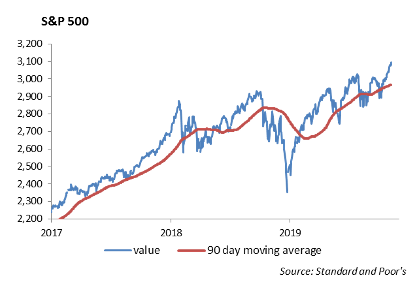
The S&P was up 0.85% last week ending at 3093, just about at all-time highs. It is up 23.39% year to date. The delay of upcoming tariffs and optimism on a trade deal really pushed markets to new highs this week. Third quarter earnings are beginning to wind down, and have come in better than expected. Through last Friday, 446 S&P companies have announced third quarter earnings, with 74% coming in above consensus. The overall decline for the quarter is now at negative 0.50%, versus a negative 3.2% at the start of the reporting season.
In terms of sector performance, technology has really taken off, with gains of 38% YTD. Great earnings from most of the large cap names and the semiconductors have really fueled this rally. Semiconductors are at all-time highs, and more than 80% of companies have exceeded their forecasts, while over 75% have exceeded revenue expectations. Industrials and Financials have also seen a very nice 1-month rally of 9% and are up 27% and 25% YTD, respectively. All sectors have seen double digit gains year to date, except for Energy, which is up 5% this year.
Qualcomm stock was up 6% after it beat on revenue and earnings. Its licensing segment generated $1.15 billion in revenue, which helped its profit. Qualcomm’s settlement with Apple and royalty agreement with Huawei were contributions to this segment. Their forecast was in line with expectations. Furthermore, they estimated that 200 million in 5G handsets will ship next year, so we will continue to watch this key revenue driver as the company’s stock is one of our largest holdings in our Focused Growth model.
There were quite a few market movers to the downside this week after earnings:
- Uber: Fell 6% despite a beat on estimates; reported a quarterly loss of over $1 billion.
- Expedia: Fell 27% after an earnings miss of 40 cents and revenue miss.
- TripAdvisor: Dropped 22% after missing top and bottom lines.
- Shake Shack: Fell 13% after same stores sales growth missed the 2.5% estimate.
- Party City: Fell 67% after it reported an unexpected quarterly loss of 28 cents.
Earnings for the upcoming week: CBS and Tyson report Tuesday, Cisco is on Wednesday, and Walmart is on Thursday. Next week, we wrap up Consumer Discretionary with Home Depot, Kohl’s, TJX, Lowe’s, Target, Macy’s, Gap, and Nordstrom.
Fixed Income
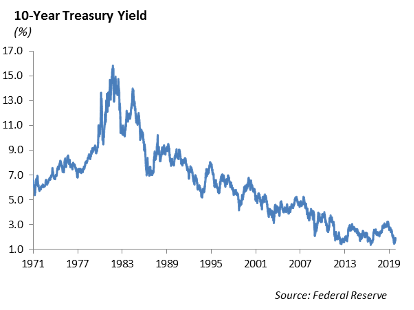
The theme remains that markets are driven by trade negotiations with China. Money managers seem to be sitting on their hands as the bifurcated risk is not worth taking a strong bet in one direction or another going into year end. The increasing likelihood of a tariff roll-back shifted the market back into a risk on mode. This drove interest rates generally higher and spreads tighter. The 10-year US Treasury widened over 15bps during the past week to a level of 1.94%. We believe further rate cuts by the Fed are unlikely in 202,0 but long-term rates will be capped due to such low rates across the globe. We are beginning to lengthen portfolios tactically as we see foreign flows picking up with US rates widening. While we are currently using treasuries to lengthen duration, we anticipate shifting back into credit after spreads normalize off of current near-term tights.
Municipal Bonds
As rates increase sharply, municipal yields outperformed treasuries by roughly 5 bps over the past week. We are seeing elections begin go play into municipal bonds as democratic upsets in Virginia and Kentucky are likely to lead to increased spending. Supply has continued to be strong going into the holiday season and we expect that to continue this coming week but maturing bonds continue to outpace maturing bonds. We continue to believe municipals across the curve will outperform based on technical, favorable tax adjusted yields relative to corporates, and decreased volatility.
High Yield
Junk credit came back very strong to start the month of November after a weak close to October. The high yield credit index tightened almost 25 basis points, which was more than enough to offset the losses due to a week best summed up with an aggressive parallel shift upwards in interest rates. Reminder that although high yield credit is not impervious to changes in the treasury yield curve, high yield being priced in dollar amount does give some interest rate protection rather than investment grade credit, which is priced directly in reference to the yield curve with option-adjusted spread. Spreads movements in high yield followed the more conventional line of thinking, with spread tightening we saw the lower ratings outperform the up-in-quality credits. CCCs tightened the most with almost 50 bps of compression, while Bs tightened over 20, and BBs brought up the rear with 15 bps of tightening.
The reasoning for performance in high yield is much the same as the reasoning for higher interest rates and a positive equity market. News out of China that tariffs can be taken off in phases was a definite boon broadly across asset classes. A real nice weak of energy prices also helped the high yield market perform well. Independent Energy and oil field services were two of the three top performing sectors month to date in the Bloomberg Barclays High Yield Credit Index.
Fund flows in high yield funds have put back to back weeks of positive inflows. After closing the month of October with a grand total of $1.5 billion entering high yield funds, we started November with a strong $400 million entering high yield mutual funds and ETFs.
The high yield primary market was as expected pretty quiet this past week. Low BB rated Silgan Holdings issued $400 million of a short 10-year private placement and MSCI also issued a private placement deal totaling $500 million. Both saw reasonable levels of demand and have tightened off of the break. Expect this level of activity to continue as we get close to holiday season with an ancillary deal here or there coming to market.
As alluded to previously, energy had a great week with both crude oil and natural gas rising over 5.5%. Crude oil sits at over $57/barrel which is the highest level since the attack on the Saudi Arabian facilities back in September. Expect further volatility in energy prices. Information released by energy companies states that a price per barrel of $65 is optimal, do not expect prices to be sustained at that level.
This report is published solely for informational purposes and is not to be construed as specific tax, legal or investment advice. Views should not be considered a recommendation to buy or sell nor should they be relied upon as investment advice. It does not constitute a personal recommendation or take into account the particular investment objectives, financial situations, or needs of individual investors. Information contained in this report is current as of the date of publication and has been obtained from third party sources believed to be reliable. WCM does not warrant or make any representation regarding the use or results of the information contained herein in terms of its correctness, accuracy, timeliness, reliability, or otherwise, and does not accept any responsibility for any loss or damage that results from its use. You should assume that Winthrop Capital Management has a financial interest in one or more of the positions discussed. Past performance is not a guide to future performance, future returns are not guaranteed, and a loss of original capital may occur. Winthrop Capital Management has no obligation to provide recipients hereof with updates or changes to such data.