The Economic Recovery Will Take More Time
The efforts to control the coronavirus have had a severe impact on the economy. Over a 45 day period beginning in early March, much of the economy has been shut down. The full economic impact of the business closures will not be seen until the economic data for April and May data is released. We expect the domestic GDP to crater by -9.4% in 2Q 2020 and a similar decline in other developed countries. China’s GDP is expected to decline by -4% for the 1Q 2020 as industrial output declined -13.5% for the first two months of the year.
In order to make sense of this crisis, we separate the impact of the coronavirus on the economy, the financial system and the capital markets as a way to provide focus and priority on investment decisions.
The Economy
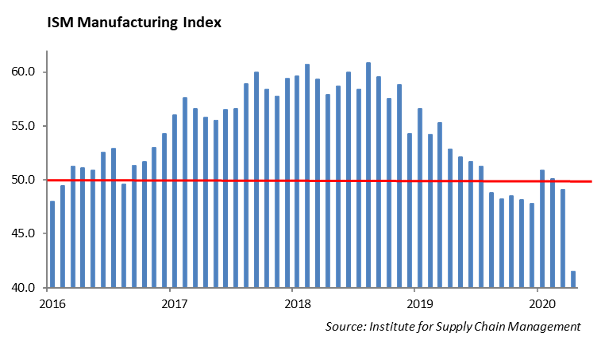
- The economic pain is still early. The ISM index for April fell to 41.5% from 49.1% in March.
- The only way that the economy can re-open in a sustainable way is to have easy access to COVID 19 testing and an effective way to control the spread of the virus. We are still a ways off from those two issues being addressed.
- We expect as businesses move slowly toward re-opening, there will be an increase in bankruptcies and business closings. J.C. Penny, Neiman Marcus, and Diamond Offshore Drilling recently declared bankruptcy.
- In addition, we expect rent payments for businesses in May and June will be down which will put pressure on commercial real estate.
The Financial System
- The Federal Reserve is the backstop for capitalism in the United States. This is a shift in the role of our central bank. While it will help keep the economy moving and is helping to support higher valuations for assets, arguably, it effectively squeezes out investors that are hoping to buy assets at lower valuations.
- We can debate whether this is their role, whether it is the right thing to do, and how it impacts capitalism, but this is our reality today.
- The bond market is the mechanism that allows corporations to refinance their debt.
- The strength of the financial system is its banking system which allows money to flow from savers to investors. Domestic banks are significantly stronger following the Financial Crisis of 2008. The European banks are in a weaker position which will hamper the economic recovery in Europe.
The Capital Markets
- Bond yields are near historic low levels and we expect interest rates to remain low as we move slowly through to recovery.
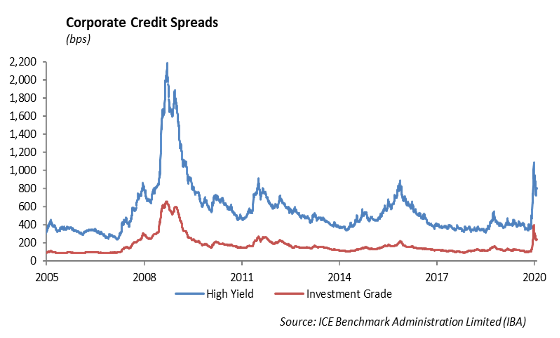
- Credit spreads have moved in sharply since March, but remain outside the tight levels we saw at the end of last year. There is still significant value in credit based strategies.
- CMBS will start to show problems. Watch for deals heavy in retail and hospitality.
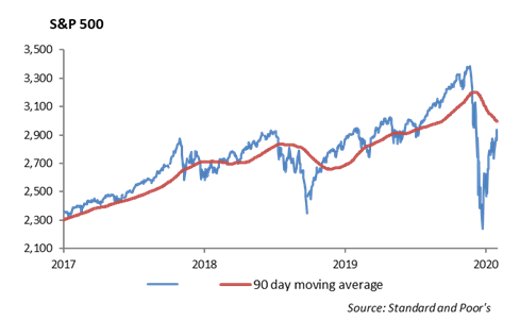
- Equities have responded well to stimulus. The S&P 500 is +28% from the low levels of March and down -15% from the high level of January. We believe valuations in the equity market are on the high side. There is also concentration risk in several ETFs including the S&P 500 where the top 5 stocks now represent over 20% of the market value of the ETF.
- We believe it is too early to move into small cap and expect challenges as companies shift business models, access capital and right size the balance sheets. The S&P 600 was down -23% in March and up 12% in April.
Equity
Tech and Healthcare Lead Performance forApril
The S&P 500 Index ended the week at 2830 and is currently down -12.38% year-to-date. However, the index finished the month of April with its best run in 30 years.
The attempt at a rebound relies very heavily on high growth technology stocks. According to the Technology Select Sector SPDR Fund (XLK), the Technology sector is currently down -3% year-to-date and outperforming the index by 9%. The Healthcare sector’s performance is not far behind. Almost 80% of Information Technology stocks and 70% of Healthcare stocks in the S&P 500 are trading above their 50 day averages. At some point, these stocks will be considered “overbought,” and it is difficult to see continued momentum that we saw in April. The current rally differs greatly from last year’s recovery where every sector contributed to growth. The S&P has remained fairly flat for the last 2 weeks.
Earnings Update
We are about halfway through the 1Q 2020 earnings reporting season. The overall consensus for the quarter confirms a -13% decline from last year’s first quarter. Positive earnings reports from Technology sector and Consumer Staples sector helped to soften the blow.
- Alphabet, Inc. (GOOGL) – Our earnings preview provided last week predicted that Google would beat estimates for the quarter. Google’s earnings report this week confirmed this as the stock rose over 7% on its release. Revenue came in at $41.16 billion versus the $40.29 billion revenue expected. Advertising revenues were $33.76 billion, rising 10% from the previous year.
- Facebook, Inc (FB) – Facebook also experienced positive results, rising 10% after its earnings release. Revenue was up 18% up to $17.74 Billion. Monthly users was up to just shy of 3 billion compared to 2.89 Billion last quarter. Cash rich tech companies are continuing to show strength.
Upcoming earnings for May 4th to May 8th include General Motors, CVS, Allstate, Disney, BMY, and CBS.
Portfolio & Model Updates
Based on the recent rally in stock prices, we are looking to add defense back into the Portfolio Models. We are expecting to reverse the trade out of minimum volatility large cap we executed in early April, and are looking to add to the iShares Minimum Vol ETF (USMV) this week. Last month, we sold out of USMV and increased allocation to the Schwab US Large-Cap ETF (SCHX) because it had outperformed given its lower beta. With the S&P rising 13% in April, we are transitioning back to a more defensive position. USMV has an expense ratio of 0.15% and is sector neutral, so it does not have aggressive exposure to real estate and utilities.
Fixed Income
Investment Grade Credit Leads Performance for April
U.S. Treasuries rates were largely unchanged through the month of April as rate volatility collapsed. Investment Grade Credit, on the other hand, had a very strong performance as the Fed announced purchase programs of risk assets. While the Bloomberg Barclays US Aggregate Bond Index returned 1.77% for the month, the Investment Grade Corporate Bond Index returned 5.24%. Despite continually declining oil prices, investment grade energy outperformed, tightening over 200bps over the month. In general, corporate credit has tightened in over 150bps from its March peak of 373bps option-adjusted spread.
Boeing Issues 6th Largest Public Debt Deal in History
As overall volatility declines and rates remain low, it is no surprise that corporate new issuance was heavy again last week. We expect heavy new issuance will continue into next week. Boeing overwhelmed the market with a $25 billion deal that marked the 6th largest public debt deal in history. Boeing recently took down $13 billion in a private credit facility and cut their dividend in order to preserve cash. This stands in contrast to the $60 billion bailout the company was exploring in late March and then later turned down. After this last deal, Boeing dropped down to a BBB- rating. Boeing was an A-rated company a year ago. Issuing public debt allows the company to remain in operation, while keeping the government out of its board rooms, stock buyback programs, and compensation levels. We have become increasingly pessimistic on Boeing bonds as the 737 MAX aircraft issues have become only a portion of the company’s problems.
Shifts in Fixed Income Portfolios
In our fixed income portfolios, we began to increase our allocation to credit after spreads had widened significantly. As the Fed announced its corporate purchase programs and spreads tightened, we have begun to reduce risk in portfolios by selling corporate bonds and buying treasuries. While we would generally increase credit at current levels, we have shifted to higher quality companies that we believe can better withstand volatility in the current environment.
High Yield
Higher-Quality Bonds Outperform
The U.S. High Yield Corporate Bond Index tightened 33 bps last week. On May 1st, Pemex, Ford Motor Company, and Occidental Petroleum Corporation were downgraded from investment grade indices and joined the high yield market. Total returns by the quality tiers were dislocated. B-rated companies had the best performance last week, returning 1%. BB-rated companies returned just over 0.5%. CCC-rated companies underperformed, returning -1%. It still pays to be “up in quality” in junk bonds.
The high yield primary market began to slow down as $2.8 billion of new paper was priced last week. Notable deals included Arconic Corporation and PolyOne Corporation, which both issued new debt for liquidity support. Del Monte Foods, a CCC-rated company, issued $500 million issuance of 5-year debt at 11.875%. Delta Air Lines, Inc.’s offering last week remained in the investment grade index with its first lien on their higher profile airport slots.
Energy
Energy markets continue to be incredibly disorganized. WTI Crude Oil prices rose 17% to almost $20 a barrel, but prices still vary widely depending on delivery date of contracts. Prices rose as production began to decrease. U.S. Oil Rig Count fell by 53 to 325 rigs, which is less than half of its highs in mid-March. Chevron announced plans to shut down about 400,000 barrels a day, and Exxon Mobil announced plans to drop 75% of its Permian Basin by year-end. The OPEC+ cuts have now taken effect with the start of May, and much of the impact has already been priced into the market.
This report is published solely for informational purposes and is not to be construed as specific tax, legal or investment advice. Views should not be considered a recommendation to buy or sell nor should they be relied upon as investment advice. It does not constitute a personal recommendation or take into account the particular investment objectives, financial situations, or needs of individual investors. Information contained in this report is current as of the date of publication and has been obtained from third party sources believed to be reliable. WCM does not warrant or make any representation regarding the use or results of the information contained herein in terms of its correctness, accuracy, timeliness, reliability, or otherwise, and does not accept any responsibility for any loss or damage that results from its use. You should assume that Winthrop Capital Management has a financial interest in one or more of the positions discussed. Past performance is not a guide to future performance, future returns are not guaranteed, and a loss of original capital may occur. Winthrop Capital Management has no obligation to provide recipients hereof with updates or changes to such data.