The Financial System is Under Stress
While there have been pandemics and the spread of diseases over the centuries, this is the first time in modern history that we are facing a global pandemic. Candidly, it is pretty scary. Under our Winthrop Capital Management Business Continuity Plan, we have implemented our contingencies which require employees to work from home and stay safe.
As a result of efforts to control the spreads of the coronavirus, the economy is going through a severe contraction, the likes of which we have never experienced. In addition, the financial system is under tremendous stress as a result of efforts to control the spread of the COVID-19 virus, which is compounding the volatility in the market. Maintaining the plumbing of the financial system is critical to allowing the economy to function as best as it can under the current circumstances.
Unlike the during the Financial Crisis, the banks are well capitalized today with over 8% Tier 1 capital levels, compared to 4% in 2008 leading up to the Financial Crisis. Our financial system is leveraged. With that capital, banks make loans. Similarly, insurance companies can sell life insurance and annuities. While we believe the capital levels supporting banks and insurance companies is adequate to weather this storm, there is an increase in the number of small business loans that are defaulting because of the economic shutdown. Businesses such as restaurants, bakeries, nail salons, gift shops and event planning businesses, are under financial pressure which makes servicing the debt more difficult. Financial stress reveals itself in markets in various ways.
Indications of Stress in the Financial System:
- Prices of bank stocks. The KBW Bank Index, which is a modified capital weighted index of 24 money center and regional bank stocks, is down -46.58% year-to-date.
- Short term lending facilities. This includes repurchase agreements and commercial paper. The financial system relies on short term lending. After September 16, 2019, the Federal Reserve has intervened in the $4 trillion repo market to support overnight lending. The Federal Reserve has announced an increase its repo operations to $500 billion to provide adequate reserves to the financial system.
- The derivatives market. The increase in volatility is distorting pricing on several types of derivatives options, which makes hedging more difficult. While most derivatives trading is electronic, posting collateral and measuring margin during a pandemic can be difficult if people work remotely. We are seeing the financial stress impact through the derivatives market as volatility climbs near record levels.
- The leveraged loan market and the prices of Collateralized Loan Obligations (CLO’s). The S&P/LSTA U.S. Leveraged Loan 100 Index is down -19.6%; however, since this index consists of private placement securities, price transparency is more difficult. We expect these leveraged loan pools to show stress at quarter end pricing.
- Closed end funds. These funds use borrowed money to buy securities such as high yield bonds or municipal bonds. When the underlying assets, such as energy stocks, decline, the net asset value of the closed end fund deteriorates. However, because they sell at prices different from the NAV, they can trade at a discount to their fair value. The size of the discount in some cases is now between -25% and -50%. At some point, we expect the lenders will step in to reduce leverage and the line of credit which will cause a forced selling of the underlying collateral.
Equities
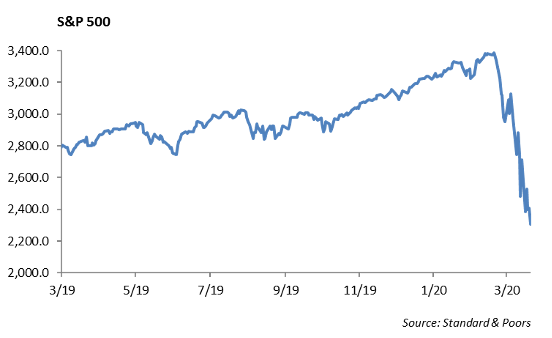
This past week closed as the 6th consecutive week without back to back gains from the market. The average move of the S&P 500 was around -5% a day. For the week, the S&P fell -15%, and is now down roughly -31% from its highs in February.
Companies in the Consumer Staples sector have been some of the best performing stocks throughout the mess, but on a 1-month basis, the sector is still down -22%. The worst performing sectors are energy, falling -52%, and financials falling -39%.
In this very challenging environment, we believe security valuation matters. We believe there are companies that are trading at attractive valuations. At this time, we are looking at Amazon, as closure of physical stores will only add a bigger draw to online shopping. In addition, Apple, Starbucks, and Nike are other names we are looking at as stores have begun to reopen in China, and all 3 of those stocks have been hit quite hard over the last month. In China, there seems to be a promising rebound in the market, and we will continue to reference China as an indicator. On average, the global market is down -26% from 52 week highs. The Shenzen index, which is China’s Nasdaq, is actually only -7% off of its 52 weeks highs. In this light, we believe that Alibaba would be another attractively valued stock, given its online presence, low level of debt, and as its market, the Chinese economy, seems to be emerging from instability.
Model Portfolios
We have made several changes within our Model Portfolios over the past several weeks as volatility has escalated. Across our Core and Tactical Allocation, we are systematically reducing the allocation to the sector neutral iShares MSCI Minimum Volatility ETF (ticker: USMV). Last quarter, we split our large cap exposure and added minimum volatility strategies to act as a buffer in periods increased volatility. This strategy has outperformed the S&P 500 index on a relative basis over this time.
Fixed Income
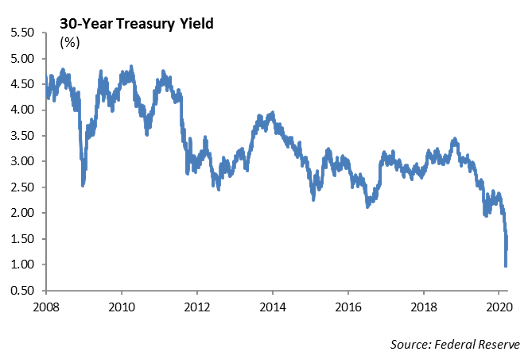
Rates trended lower last week, with the yield on the 30-year U.S. Treasury bond falling below 1.42% to end the week. Rate volatility, as measured by the MOVE index, remained high at 133%. The most interesting metric of the week was global negative yielding debt. After peaking at $17 trillion, it has remained steady between $12-14 trillion for months. Last week, it dropped significantly to only $8 trillion as global rates dramatically rose. The cause of such dramatic rate increases is up for debate. While some argue that measures needed to stimulate the global economy will result in massive amounts of debt issuance leading to higher rates, others argue it is a sign of a market bottom as the outlook for long term growth is beginning to improve.
The large moves in Treasury prices are linked to flows in the U.S. dollar. The recent market volatility has demonstrated the importance of asset allocation and including an allocation to fixed income. However, investors in a diversified asset allocation may be frustrated with the relatively poor performance from some fixed income funds. For example, the iShares 20 year treasury bond ETF (ticker: TLT), a long duration US treasury fund, is up 18% year to date, but the iShares IBoxx Investment Grade Corporate Bond ETF (Ticker: LQD), an investment grade corporate bond fund, is down -16% for the year. Regardless of the effects of the virus, we believed the credit markets were overvalued at the beginning of the year and cautioned investors from overreaching for yield in both credit quality and duration. As markets have sold off to spreads of over 300bps, we believe this as a buying opportunity in credit. In addition, prices of tax-exempt municipal bonds have also dislocated significantly, and for the first time since the financial crisis, they are trading at significant premiums to U.S. Treasuries. Currently, AAA rated 30-year municipal bonds are trading at 169% of U.S. Treasury yields.
High Yield
Liquidity and credit quality are the major concerns in the credit market at the moment, which boils down to the front-end stress of many credit curves. This arises from two main issues. First, investors have very real concerns about company’s ability to refinance near term debt particularly in the energy sector. And second, thin trading is continuing to reset price discovery in the high yield market.
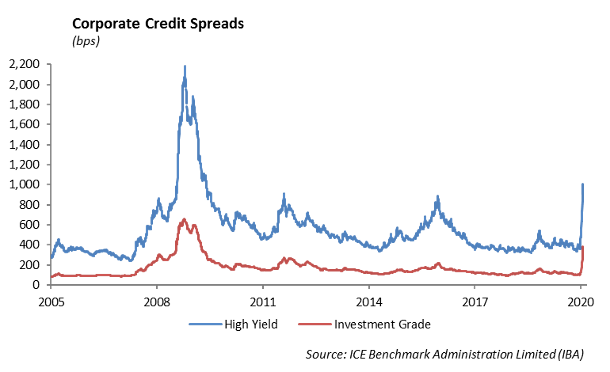
Investment grade spreads widened by 158 bps last week. Spreads are now 4 times wider than the start of the year, and the yield to worst of the investment grade credit index is at 4.7%, the widest level we have seen in a long time.
The spread widening is even more pronounced in high yield sector. The High Yield index widened 278 bps to an option-adjusted spread of over 1,000 bps. The index is at its widest level since July 2009. Much of the widening has come in pronounced, one-day moves, including last Monday’s 107 bps, and Thursday’s 78 bps moves wider. On a year to date basis U.S. high yield is down almost 19%. Fund flows saw $3 billion in outflows last week, which brings the total amount to just over $17 billion in the last four weeks. The primary market has been inactive since March 4th, and we expect the same this week.
We believe that spreads in high yield still has the potential to get worse before it gets better. Our concerns are with energy credits. We are opportunistic in our portfolios and will move up in quality into short term investment grade credits depending on liquidity of the market.
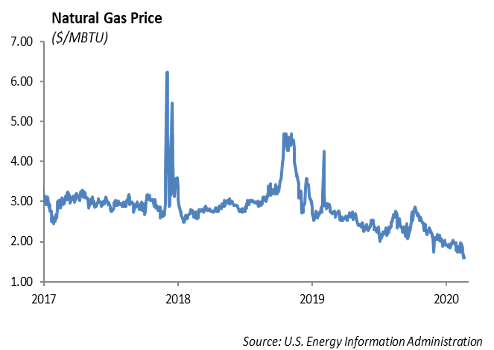
Energy
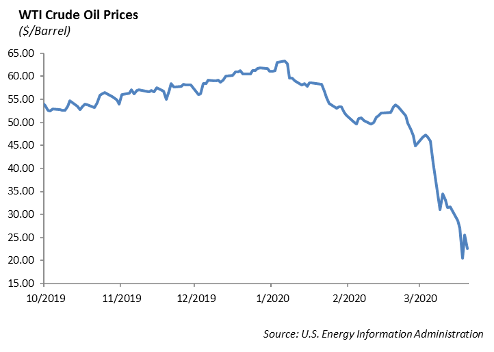
The energy markets were bludgeoned again last week. WTI crude oil fell -29% to $22.43/bbl, and natural gas fell -14% to $1.60/mcf. These are the largest weekly declines since 1991 and are back to levels seen in 2001. The story is nothing new as coronavirus demand weakness and OPEC+ prices continue to devastate oil and gas prices. Oil prices began to recover late last week as reports came out that members of the Texas Railroad Commission received an invitation to the June OPEC meeting. The sharp drop in oil prices will have a significant impact on bank lending to pipelines and energy companies. We would expect to see banks reduce lines of credit over the next quarter which will further stress the capital structure of energy companies.
This report is published solely for informational purposes and is not to be construed as specific tax, legal or investment advice. Views should not be considered a recommendation to buy or sell nor should they be relied upon as investment advice. It does not constitute a personal recommendation or take into account the particular investment objectives, financial situations, or needs of individual investors. Information contained in this report is current as of the date of publication and has been obtained from third party sources believed to be reliable. WCM does not warrant or make any representation regarding the use or results of the information contained herein in terms of its correctness, accuracy, timeliness, reliability, or otherwise, and does not accept any responsibility for any loss or damage that results from its use. You should assume that Winthrop Capital Management has a financial interest in one or more of the positions discussed. Past performance is not a guide to future performance, future returns are not guaranteed, and a loss of original capital may occur. Winthrop Capital Management has no obligation to provide recipients hereof with updates or changes to such data.