Investment Themes
We are coming up on the half-way point of the year and believe it is a good time to reassess our investment themes and portfolio structure.
- The domestic economy is growing between 1.8% and 2.0%. Growth is slowing as the impact of the Tax Act of 2017 diminishes and manufacturing slows. Business investment has slowed as tariff issues grip supply chains and capital spending budgets. The labor market is the critical factor keeping the Fed from moving to lower rates; however, if we see continued deterioration from the May labor report, we expect the Fed will move quicker to lower rates. Slower economic growth will help keep interest rates low and provide downward pressure on corporate earnings.
- The trade war with China has contributed to the slowing domestic economic growth rate. We expect that Trump will want to get a trade deal nailed down with China close to announcing his re-election campaign. The G-20 meeting in Japan on June 28 will likely be the next hurdle. The trade war has really turned into an economic and technology war: China and its central, state-controlled economy and businesses versus the United States and its democracy with free markets.
- The drama around Brexit is as good as the Great British Bake Off show. Boris Johnson is the apparent leader to replace Theresa May. The Brexit process has put a significant weight on both the U.K. and European economies and contributed to a slowdown in growth. We do not expect an acceleration in growth until the lines around Brexit are more clearly marked.
- The month of May was brutal for stocks; however, equity prices have recovered sharply. The S&P 500 is up 15% so far this year. However, we expect volatility to remain high this summer unless the China tariff issues are resolved. We expect stock buybacks will be a major theme in the second half of the year as earnings growth slows.
- Liquidity in the credit markets has been difficult at times. New issue volume is down significantly and Asian buying has declined. While we do not see a significant shift in the credit cycle, the seeds are planted. Leveraged loans and commercial real estate are both drawing significant capital, and valuations appear excessive. In addition, lower oil prices will put pressure on oil and energy credits over the near term.
- Oil prices have declined 20% over the past two months and are trading at $51 per barrel. This is complicated by unrest in Venezuela and growing conflict with Iran. Iran is being blamed for attacks on two oil tankers in the Gulf of Oman last week. The growing supply of oil against the backdrop of a global economic slowdown will likely keep pressure on oil prices.
Investment Strategy
- We are reducing risk in our portfolios following the sharp rally in stock prices in May. This includes lowering large cap domestic equity. Current valuations do not support slower earnings growth expectations.
- We expect there is a point in which global markets begin to accelerate at a faster pace than domestic economic growth. We are not there yet. As a result, we have not added to international and emerging market exposure.
- We continue to shorten durations in bond portfolios given the sharp move lower in the ten year U.S. Treasury yield.
- Tighter credit spreads are pushing the up in quality trade.
- We are reluctant investors in publicly traded forms of real estate given the low cap rates and significant amount of money flowing into the development. This is a “buyer beware” market.
- In general, leverage loans are problematic for us. The amount of “covenant light” loans coming to market is indicative of a peak in the cycle. Credit based mutual funds that use leveraged loans, as well as business development companies should be approached with reluctance given current valuations.
Federal Reserve – Does the Yield Curve Matter?
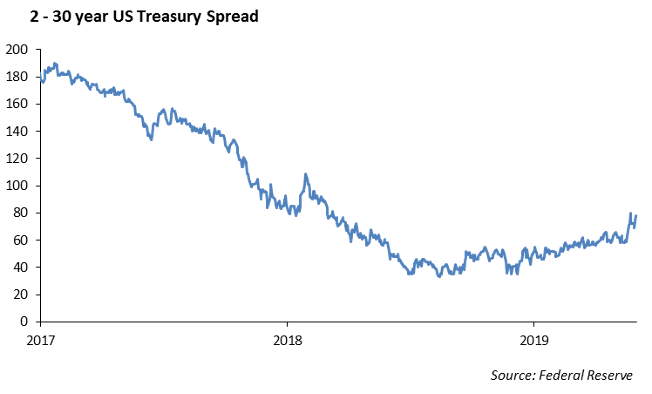
It has been said that the shape of the yield curve has predicted seven of the last five recessions. The shape of the yield curve is actually an important factor in our economic outlook and asset allocation.
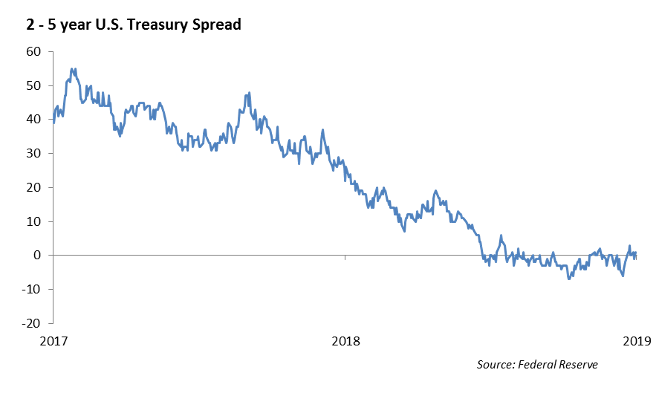
The yield curve is negative 5 bps when measured 3 month T-Bill to the five year U.S. Treasury note. However, the current spread between the 2 year U.S. Treasury Note and the 30 year U.S. Treasury bond is +77 bps. While the slope has declined significantly, the 2-30 curve is more indicative of an economy that is expanding.
Europe
Since Theresa May resigned, the U.K. parliament now has to install a new prime minister, and Boris Johnson appears to be the leading candidate. The UK has been unable to come to an agreement on terms of leaving the European Union and is left with two alternatives, leave without an agreement or a new referendum. Boris Johnson has indicated that he will lead the U.K. through Brexit, but hasn’t disclosed specific plans. While Tory hardliners and business leaders have made it clear that leaving the EU without an agreement on terms is unacceptable, we believe it holds the highest probability.
There is growing concern with Italy’s financial condition and its political direction. Italy has disclosed that it is talking about paying its public sector suppliers with “IOU’s” instead of money. Italy is also looking at a parallel currency to the euro. We do not think that Italy will voluntarily leave the euro, but rather, the EU will no longer be able to afford keeping Italy. Italy is running at 132% debt to GDP, with a 5% budget deficit and an economy that is in a recession.
Fixed Income
The rates market remained fairly quiet during the previous week. The curve was relatively unchanged except the 3-month treasury yield fell 9bps as the market is pricing in an increasing chance of a Fed rate cut. This week will be driven by the lead up and dialogue of the Fed meeting on Wednesday.
Volatility subsided during the week, but spreads widened slightly as the global macro picture seemed to improve. The investment grade index widened by 4bps, driven primarily by underperformance in the Energy sector. Energy was wider by 8bps as WTI Crude slid below $55/barrel.
We have continued to move our fixed income portfolio’s to a shorter duration tilt as rates have retraced to near term tights. Many investors may ask – why we would be shortening duration if our outlook is that the Fed will be decreasing rates? It is important to remember that the Fed only controls short term interest rates, and historically, a fed move towards monetary easing has led to a steepening of the curve as cheap funds help bolster economic growth.
Municipal Bonds
Tax-exempt muni’s continue to lag treasuries as investors have been reluctant to chase muni yields lower. Muni/UST ratios have been ticking higher, and the 10-year ratio now stands at 80% from a low of 72%. Much like treasury curves during an easing cycle, muni curves historically steepen. We have begun shortening our muni portfolios as defense against steepening and extremely low rates.
High Yield
The U.S. high yield credit market continued to come back from the widening we saw in May. The index tightened 14 basis points last week. Paired with the 20 bps of tightening we saw the week prior, the high yield index sits more than 100 bps tight to year end levels. We saw 36 bps of total return last week, with the outperformance bar belled by BBs and CCCs, with BBs the slight winner. Year to date total return is just short of 9 percent, with the quality tiers leading the way. In high yield ETFs and mutual funds, we saw the largest inflow in 10 weeks, to the tune of $1.72 billion.
We saw $4.6 billion of high yield new issuance last week, bringing the month to date supply $10 billion. At this point, we are comfortably above prior year’s issuance level. Reception of new issuance was mixed last week, with Multi-color’s leverage buy out related bond. Radian’s issuance to address near term maturities was well received while U.S. Renal Care’s CCC offering priced at the wide end of talks.
Something of note in the high yield space is the possibility of the Fed cutting rates, and how that will affect the BB curve. Historically, the treasury 2s5s curve steepens when the Fed cuts rates, and in turn, a steepening in the treasury curve flattens out the BB 2s5s curve. Isolating out the BB curve, we see that BB 2s5s is at the steepest levels since the recession. It is also 35 bps steeper than implied by the shape of the yield curve and current high yield levels. When considering the increasing possibility of a Fed rate cut in the context of a historically steep BB 2s5s curve, there appears to be significant potential value in swapping out 2 year BBs for 5 year BBs.
Equities
The S&P was up 0.47% last week and is now 2% from all-time highs. It is up 15% YTD. This was led this week by Consumer Discretionary sector which was up 2.44%. The laggard was energy, which fell 0.50%.
Looking forward to 2nd quarter earnings, the earnings decline is expected to be -2.5%. We are now looking at 2 straight quarters of year over year decline since the first two quarters of 2016. Expected revenue growth for the quarter is currently 3.9%, with 9 out of the 11 sectors expected to report positive revenue growth.
In IPO news, Chewy shares ended up 59% on the day. The online pet products company’s IPO is the largest first day return for a billion dollar IPO since Twitter in 2013. Chewy ended the day with a market cap of about $14 Billion.
Currently, 58% of stocks in the S&P 500 are currently above their 50 day moving averages. Dissected by sector, 84% of real estate stocks and 82% of utilities are above their 50 day moving averages. On the other side, only 10% of energy stocks and 38% of communication services stocks fall into this category. We have been incorporating these into our models over the last week.

Portfolio Models
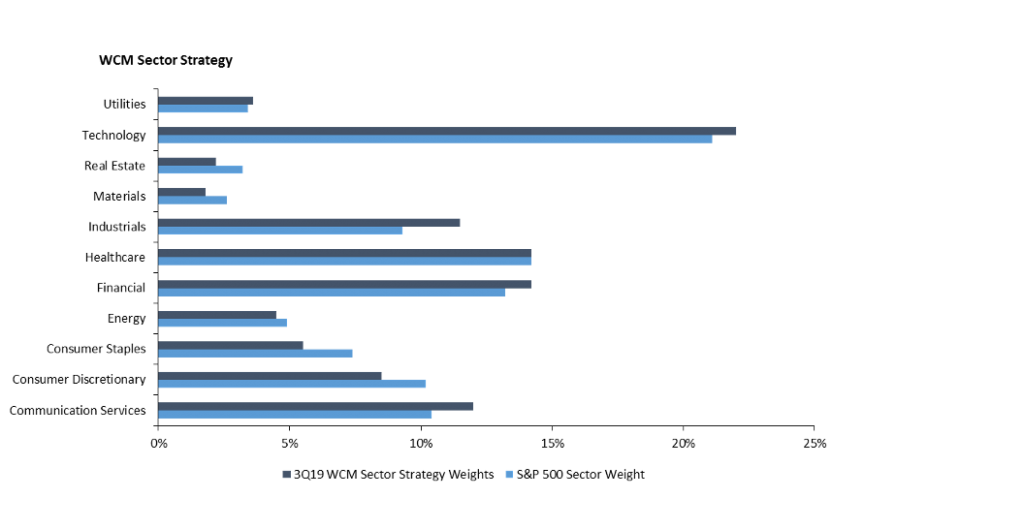
Winthrop’s outlook on the global investment landscape has spurred several ideas for shifting sector allocations across our model series in the third quarter of 2019. For example, the 5G buildout and rapid pace of technological change causes us to remain overweight the S&P in the communication and technology sectors.
We are currently underweight consumer staples. Increased competition continues to accelerate with growth in low cost production, which will continue to compress margins and, in turn, hurt earnings going forward. The trade war between China and the US will continue to impact prices, which will ultimately hit producers and increase prices for consumers.
Our core sector series, which focuses on tactical sector allocation, will be shifted in the coming weeks to reflect Winthrop’s proprietary market outlook. Our tactical series and core series will also move to reflect the outlook by taking on specific sector sleeves. The Technology sleeve, XLK, and the Communications sleeve, XLC, will be allotted 1.00% positions in the models.
This report is published solely for informational purposes and is not to be construed as specific tax, legal or investment advice. Views should not be considered a recommendation to buy or sell nor should they be relied upon as investment advice. It does not constitute a personal recommendation or take into account the particular investment objectives, financial situations, or needs of individual investors. Information contained in this report is current as of the date of publication and has been obtained from third party sources believed to be reliable. WCM does not warrant or make any representation regarding the use or results of the information contained herein in terms of its correctness, accuracy, timeliness, reliability, or otherwise, and does not accept any responsibility for any loss or damage that results from its use. You should assume that Winthrop Capital Management has a financial interest in one or more of the positions discussed. Past performance is not a guide to future performance, future returns are not guaranteed, and a loss of original capital may occur. Winthrop Capital Management has no obligation to provide recipients hereof with updates or changes to such data.