Last Friday’s report showed a strong 225,000 jobs were created in June. As the economy continues to show signs of slowing, is this enough for the Fed to begin to lower interest rates? We think not. Consensus has moved from 50bps move in July to now 25 bps in the reduction in the Fed funds rate. Given the Fed’s language of “being patient and data-dependent” we would expect to see them hold off unless we see further signs of weakness. Earnings season is lighting up this week. We expect to see a slowdown in earnings growth across the board, which will test valuations in the market. Our theme in July is to reduce risk in the portfolios.
Fixed Income
The bond market was very strong in June and ended the month with the 10-year treasury tighter by 12bps at 2.00%. The treasury curve generally steepened 4bps and the 2-30 year curve is now at 68bps. The forward curve is now predicting a near 100% probability that the Fed lowers short term rates by 75bps by the end of 2019.
The credit sector was also a strong performer during June from both lower rates and tighter spreads. The Bloomberg Barclays US Aggregate was up 0.88% during the month, marking a total return of 5.72% for the first half of 2019. Investment grade spreads have now tightened 34bps year to date and are fairly tight at 110bps. As rates and spreads have come in we continue to build defense into our total return portfolios by moving up in quality by selling credits such as Allergan, IBM, and Target while purchasing a duration neutral treasury position.

Municipals
While municipals were positive in June like other fixed income asset classes, they have slightly lagged credit and treasuries. In June the Bloomberg Barclays Index returned 0.37% and year-to-date have returned 5.09%. Muni issuance has continued to be anemic in 2019 with $34bn of issuance, marking a negative 9bn of net issuance in 2019 when factoring in maturies. Fund flows into muni funds have been strong, with a total inflow of $46bn this year. We believe these technicals will continue to drive performance in the muni market. With interest rates back at historic lows, municipals offer strong tax equivalent yields with higher quality and lower volatility than comparable corporates.
High Yield
It was a quiet week in high yield with the holiday. The US high yield index tightened 9 basis points over the week to finish at an option adjusted spread underneath 400 basis points. We now sit 135 basis points tight to levels at the beginning of the year.
On top of the 9 basis points of spread contraction, we saw 22 basis points of total return and 46 basis points of excess return. Year to date total return is now 10.35%.
B’s managed to be the outperformer in high yield last week, returning 30 basis points of performance after underperforming both BB’s and CCC’s the week prior. BB’s are still the year to date top performer in high yield with almost 11% return as investors reach for the yield of high yield and crossovers but remain defensive in the high yield space.
There was only one notable high yield new issuance last week with CSC holdings pricing $1 billion of debt to refinance revolver borrowings. Additionally, high yield fund flows remained positive with $802 million entering high yield mutual funds and ETF’s. These fund inflows paired with low issuance has supported tighter spreads in the high yield space.

Equities
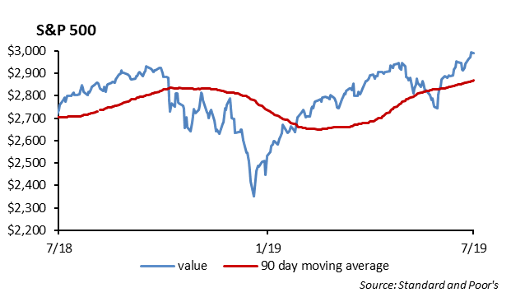
The S&P rose 1.65% last week, reaching new all-time highs again on Wednesday and currently sitting at 2990, up 19.29% YTD. Every sector was in the green last week, with the outperformers being Financials and Communication Services, up 3.37% and 3.54%, respectively. The cease fire in the U.S./China trade war aided with the rally.
For the first half of the year, the top performing sector was Info Tech, rising 29%. Communication Services and Consumer Discretionary were up 23% and 22%. Health Care was up 8.5% and Energy was up 10%.
To run through some additional stats for the first half of the year, Large Cap is up 19.18%, Mid Cap is up 20.20%, and Small Cap is the slight underperformer, up 18.37%. International is up 14.54%, while Emerging Markets are up 12.38%. The top performing individual stock in the S&P YTD is Xerox rising 83%, while the top decliner is Nordstrom, falling 32%.
There was some pullback Friday, with the S&P giving back 5 points and we are looking at a bit of a pullback this morning with less of a chance that the Federal Reserve will lower interest rates later this month on a stronger than expected employment report.
In earnings news, this week is fairly light. Pepsi reports tomorrow, while Delta Air Lines reports Thursday. Next week there is about 60 S&P stocks reporting ranging from Financials, Industrials, and the Health Care sectors.
In IPO news, there were 8 companies that filed, 4 of which are aiming to raise $100 million or more.
The Renaissance IPO Index rose 1.7% this past week and is up 39% YTD.
Portfolio Models
This week in models, we wanted to bring back up our Tactical Model Series. The Tactical Model Series has five underlying strategies consisting of: Growth, Growth & Income, Balanced, Moderate, and Conservative. Asset allocations vary per strategy with Growth holding the highest amount of equity exposure at 80% and the conservative strategy holding the highest amount of fixed income at 69%.
The goal of this strategy is to shift allocations of asset classes and funds on a consistent basis to reflect our Chief Investment Officer’s economic outlook in the volatile global investment landscape.
Some of the recent changes we’ve made to the series consist of adding sleeves of the Communications sector and the Technology sector, areas we see outperformance in the foreseen future. We have also been shifting out of long duration bond funds as we expect the federal funds rate to drop in the 2nd half of the year. The last change we have been working on in the current quarter is having an even exposure to broad market equity ETFs like Schwab US Large Cap ETF (SCHX) and low volatility equity ETFs such as the Invesco S&P Low Volatility ETF (SPLV).
This report is published solely for informational purposes and is not to be construed as specific tax, legal or investment advice. Views should not be considered a recommendation to buy or sell nor should they be relied upon as investment advice. It does not constitute a personal recommendation or take into account the particular investment objectives, financial situations, or needs of individual investors. Information contained in this report is current as of the date of publication and has been obtained from third party sources believed to be reliable. WCM does not warrant or make any representation regarding the use or results of the information contained herein in terms of its correctness, accuracy, timeliness, reliability, or otherwise, and does not accept any responsibility for any loss or damage that results from its use. You should assume that Winthrop Capital Management has a financial interest in one or more of the positions discussed. Past performance is not a guide to future performance, future returns are not guaranteed, and a loss of original capital may occur. Winthrop Capital Management has no obligation to provide recipients hereof with updates or changes to such data.