Economy
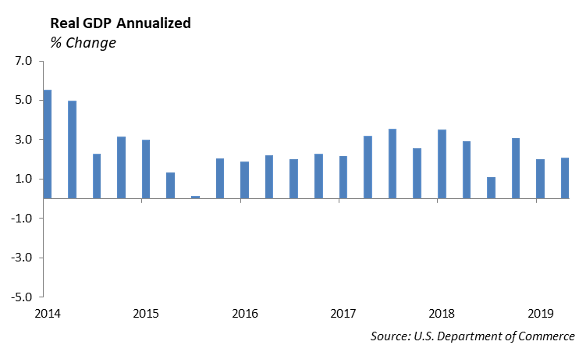
The economy is showing strength, but the recent economic figures are masking underlying weakness. The Commerce Department reported GDP growth at 2.1% for the fourth quarter of 2019. This is solid growth given the headwinds the economy is facing. The spread of the coronavirus is weighing on global growth, and we see serious downside risk to the economy. In addition, the Boeing shutdown has weighed heavily on domestic growth and could take as much as 0.5% off of annual GDP growth. Companies that makes the fuselage for the 737 MAX have had to cut production and furlough employees, including General Electric which makes the engines and Spirit Aerospace.
The labor market has been strong over the past three years; however, the amount of lay-offs is increasing. Last year, Zimmer, CNO, 3M, HSBC, Deutsche Bank, and Ford eliminated positions in their workforce. Already in 2020, Nissan, Quora and Cummins have announced layoffs. We expect companies will reduce jobs in order to protect profit margins in the face of declining profits.
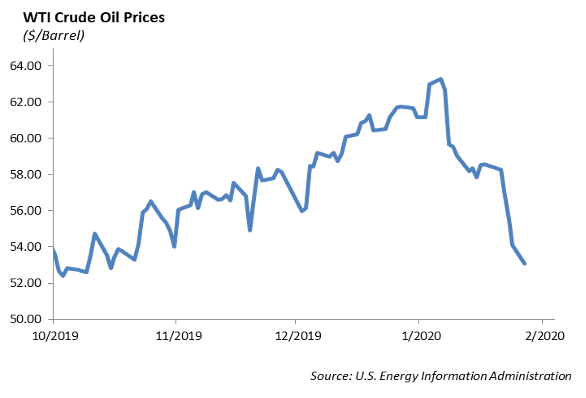
There are other concerns impacting the economy as well. Business investment declined last quarter, its third straight quarterly decline in a row, and oil prices are down 15% over the past month. This rapid shift in underlying economic fundamentals will likely force the Federal Reserve to adjust its current path for monetary policy.
While the Federal Reserve left interest rates unchanged last week at its first FOMC meeting this year, we expect the Fed will likely cut rates by March as the coronavirus dampens global economic global growth and coordinated monetary stimulus is needed. This is a shift in our initial forecast in which we expected the Fed to remain on hold for the year.
Last Friday, it became official for Great Britain – Brexit is final. Now, Britain enters the next phase of negotiations with the European Union to determine details around Brexit. These negotiations are scheduled to last eleven months. We expect capital investment will increase for both the U.K. and Europe as uncertainty around supply chains and logistics are resolved.
Fixed Income
Now that the euphoria of 2019 has been washed away by the corona virus and the threats to a global slowdown, interest rates have returned to their all-time lows. The 30-year treasury finished the week at 2.00%. Global rates followed the same course, and total market value of negative yielding debt increased to $14 trillion.
With such a strong risk off trade, it comes as no surprise that spreads have widened. With equities down significantly and treasuries tighter by over 20bps, the surprise is how little spreads have widened. The credit index is only wider by 9bps from its tights and still lies at generally historic tights. Given the overall widening, we were buyers of high-quality credits such as Citigroup and Apple as a defensive way to participate in any spread rally.
Municipals have generally matched the performance of corporates in 2019, outperforming treasuries by roughly 10bps. 10-year AAA munis currently trade at 78% of treasuries. While this does not make municipals necessarily cheap, we see high quality muni’s as a defensive place for tax consequence investors to remain as global growth is seemingly under stress.
High Yield
U.S. high yield had a bad week as worries about coronavirus continue to dominate the investment landscape. The Index widened out 35 bps, with CCCs bearing the brunt of the underperformance at 52 bps of widening. BBs are now back in the lead as its total return was the only risk tier in high yield to have positive performance.
Along with BBB’s positive total return, these factors have supported our Short Duration High Yield strategy, and the strategy is outperforming the High Yield 1-5 Year Cash Pay Index year to date. The strategy is well suited for clients looking for higher levels of income while pairing off interest rate risk. The opportunity for the down in quality trade looks to be coming as the difference in spread between B-BB’s is now over 150 bps, but spreads in general are still too tight to remain anything but defensive. With coronavirus and its adverse effect on global growth, we expect spreads between B-BB’s to get over 200 bps. Until then, we remain defensive in BB names, including stable sectors like consumer staples. Ball Corporation is a good example that should hold tight.
Equities
We are definitely experiencing more volatility in equities driven by the global economic uncertainty caused by the coronavirus.
The following companies reported earnings last week:
- Microsoft was up 4% after another solid quarter. EPS of $1.51 beat by 19 cents, and revenue of $36.91 billion beat by over a billion. Year over year revenue was up 14%. Azure grew 62%. Microsoft also won the JEDI cloud contract, which is worth up to $10 billion for over a decade. The Cloud Segment in general had $11.87 billion in revenue, up 27%. Personal Computing had $13.21 Billion in revenue, up 1.6% YoY. Productivity and Business had $11.83 billion in revenue, up 17%.
- Tesla was up 9% on earnings, breaking the $600 mark. Revenue of $7.38 billion beat the $7.02 billion estimate. In the fourth quarter, they delivered 112,000 vehicles, which is their best yet. In the last 6 months, it has almost tripled in stock price.
- Starbucks earnings came in at 79 cents vs. 76 cents. Global same store sales were 5% vs. 4.4% expected. Sales at Chinese locations were up 3%, even with Luckin Coffee adding competition there. 1.4 million U.S. customers joined their loyalty program, which was a 16% increase YoY. Like many other companies, Starbucks has warned about the coronavirus, and they are temporarily shutting down over half of its 4300 cafes in China. Although they had a great quarter, they have put profit forecasts on hold. Since China accounts for about 10% of total revenue, the stock ended down 1.5%.
- Apple reported revenue and profit that beat expectations, and the stock was up 3%. Revenue was up 9% to $91.8 billion, with iPhone revenues up 8% to $55.97 billion. They beat by over $4 billion on the new iPhone 11 models. Services was up 17% YoY to $12.7 billion. Apple’s other products revenue was $10 billion, which also beat estimates. This segment includes Apple Watch and AirPods.
- PayPal reported earnings of $0.86, which beat by 3 cents, and revenue of $4.96 billion was up 17%. Fourth quarter total payment volume of $199 billion was up 22%. Venmo was up 56% with $29 billion of total payment volume. There were 52 million active Venmo accounts in the fourth quarter, which is up 12 million from April. Transactions were up 21%, and new accounts were up 14% up to 305 million. Although initially falling by 7%, the stock did recover, ending the day down 2%.
Energy
Energy also suffered last week with questions in growth and demand levels meaningfully taking its toll on crude oil and natural gas prices. Oil fell about 5% last week and natural gas fell about 3%. This is the worst start to the year for energy prices since 1991. China is a key driver for oil demand and with the events going on over there expect prices to remain under pressure. OPEC+ has suggested that it will be cutting supply to support the market but timing on that remains in question. The energy sector ETF is down almost 12% year to date with large integrated companies such as Exxon, Royal Dutch Shell, and Chevron all underperforming the ETF as a whole. Those companies all reported earnings last week, giving either mixed or missed results. Top line results have repeatedly been under pressure as prices negatively impacted downstream results, but earnings have held in close to estimates as companies have cut costs. We are neutral on the sector as a whole.
Model Portfolios
We have several initiatives in our Model Portfolios. We have been looking for an entry point to add to International and Emerging Markets exposure. With the threat of the coronavirus, China’s equity market is down 15%, and we are seeing a potential to increase our emerging market exposure in several Portfolio Models.
In the Core Series, we continue to shift the equity basis from a large cap growth bias in order to build downside protection. We have increased our exposure to dividend growth ETF’s.
In our WCM Tactical Models, we have sold our position in the American Funds EuroPacific Growth Fund, ticker AEGFX, and have added to our position in the Vanguard All World Ex-US ETF, ticker VEU. At an expense ratio of 0.09% bps and solid annualized returns vs. the category average, while still holding that exposure to the giant cap companies of Hong Kong, we felt the Vanguard ETF is a much better play that the EuroPacific Growth Fund. This was a swap we did across our Growth, Growth and Income, Balanced, Moderate, and Capital Preservation strategies.
Additionally in our WCM Tactical Models, we have sold our position in the Jensen Quality Growth Fund and used the proceeds for the Schwab Dividend Growth ETF. Although we like Jensen’s screening method and diversification to large cap companies we normally wouldn’t hold, we felt that their expense ratio of 0.87% doesn’t warrant the performance they have had against the S&P. Their top 10 holdings make up 55% of the Fund with companies like 3M, which we choose to avoid. We felt the Dividend Equity ETF would provide similar performance with additional income, while reducing our expense ratio.
This report is published solely for informational purposes and is not to be construed as specific tax, legal or investment advice. Views should not be considered a recommendation to buy or sell nor should they be relied upon as investment advice. It does not constitute a personal recommendation or take into account the particular investment objectives, financial situations, or needs of individual investors. Information contained in this report is current as of the date of publication and has been obtained from third party sources believed to be reliable. WCM does not warrant or make any representation regarding the use or results of the information contained herein in terms of its correctness, accuracy, timeliness, reliability, or otherwise, and does not accept any responsibility for any loss or damage that results from its use. You should assume that Winthrop Capital Management has a financial interest in one or more of the positions discussed. Past performance is not a guide to future performance, future returns are not guaranteed, and a loss of original capital may occur. Winthrop Capital Management has no obligation to provide recipients hereof with updates or changes to such data.