Economy
It is still early in the earnings reporting season, but so far, fourth quarter 2019 earnings have been strong. The equity markets, however, are under pressure largely due to the coronavirus moving beyond China. The growing reach of the virus raises increased concerns of a deeper economic slowdown in China. The Chinese government has imposed lockdowns on three major cities, curtailed flights, and shut down public transportation in an effort to control the spread of the virus. In spite of China’s aggressive steps to contain the outbreak, there are five cases now in the United States. The concern has depressed stock prices of airlines stocks as people stay home over the Lunar New Year in China.
Boeing has indicated a more conservative schedule for its 737 MAX, which also weighed on some airline stocks. The company indicated that it expects the plane to fly this summer, which includes pilot training. Boeing has a major impact on the economy, and the longer production is halted, the greater the weight on domestic economic growth prospects. Boeing will release earnings this Wednesday, and they will not be pretty.
Transportation stocks as a whole have lagged the broader market, and the Dow Jones Transportation Index remains nearly 5% below its record high in the third quarter of 2018. We are watching to see if this is part of a broader sluggishness in the economy.
This Friday, Brexit will actually happen. Four years in the making, and it will be final on January 31, 2020. With the United Kingdom leaving the European Union, we expect capital investment will increase for both the U.K. and Europe as uncertainty around supply chains and logistics are resolved. We see this as a barrier to global growth that has been removed.
Small & Mid Cap Equities
The performance of small cap and mid cap stocks has lagged the broader equity market measured by the S&P 500 over the past several years. Over the past twelve months, small cap stocks measured by the S&P 600 lagged large cap by -13.7% and measured by the Russell 2000 by -11.5%.
This sheds light on several issues in the capital markets. First, the rally in stocks last year was dominated by large cap stocks. With the large cap rally, investor flows were dominant in the S&P 500 stocks as Exchange Traded Funds become a larger presence in the market. It is not unusual for small cap stocks to lead in a market rally, but this has not been the case.
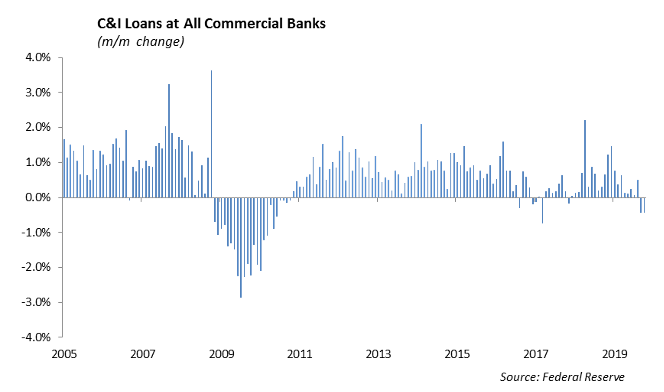
Historically, small cap stocks rally when private credit is expanding. Since 2011, bank lending measured by the growth in consumer and industrial loans has been stable, but not excessive, in its expansion. In addition, a growing number of smaller cap companies have been able to access debt through the high yield market, which makes the comparison to bank lending difficult.
S&P 600 Small cap earnings declined 10% in 2019 from the prior year, despite revenue increasing 6.5%. Much like other equity asset classes, valuations became increasingly stretched during the past year, and multiples expanded. While the S&P 500 is trading at multiples that are at the highs of the past 10 years, small caps are still well below their peak of 30x earnings in 2017. Margin compression has been the largest tailwind to small caps. While large caps, which have a net margin around 10% small caps, were at a 10-year low of 2.06% in 2019.
Active managers have lagged passive managers in small and mid-cap stocks. But through 2019, the performance was more mixed with several active managers gaining ground against the indexes.
Stock report
J&J reported EPS of $1.88 vs. $1.87 and revenue of $20.74 billion vs. $20.8 billion. Their pharma business continued to be the driver with $10.54 billion in revenues, a 3.5% increase YoY. The consumer unit reported $3.5 billion which was up 1% YoY, and their medical device unit reported $6.63 billion, which was down half a percent. They are still facing lawsuits from its talc baby powder and the opioid epidemic. Litigation expenses are a lot lower this quarter at $264 million, compared to $1.29 billion last year.
Specifically, Remicade (arthiritis) was up 5.4% in the quarter to $3.5 billion, Darzalex (Multiple Myeloma) was up 9.1% to $2.7 billion, and cancer drug Imbruvica was up 42% to $830 million.
Netflix added 8.8 million subscribers in the 4th quarter, in line with what they added last year and beating the 7.6 million estimate. They did have a dramatic decrease in US and Canada, adding 550,000 subscribers vs. 1.75 million last year due to competitive launches such as Disney+, Apple TV. With NBCUniversal releasing Peacock and AT&Ts HBO Max, this number could continue to decline.
Tesla became the first $100 billion publicly listed US carmaker, with shares rising to $572 and New Street Research raising its PT to $800. The stock has doubled in 3 months.
Fixed Income
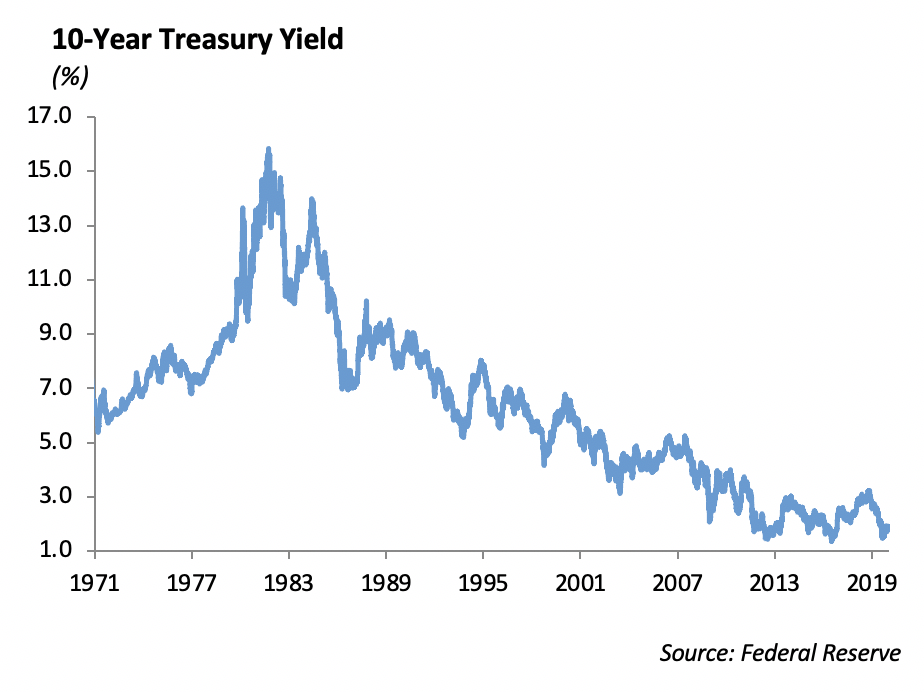
The global flight to safety over the past week led to a 15bps decline in treasury rates. The 10-year treasury ended the week at 1.68, and global rates followed. After weeks of a decrease in the amount of negative yielding debt around the world, last week saw a sharp increase back above $12 trillion.
Despite the sharp drop in rates and a general risk off tone in equity markets, investment grade credit spreads remained tight. The credit index still has a spread below 100bps. Primary markets have continued to be very active, and issuance so far this year has surpassed early expectations. Low rates will likely incentivize further upsized corporate issuance.
Last week, we were buyers of Boeing debt after continued issues with the 737 Max lead to 30bps of widening in long end bonds. Boeing has secured $10bn in bank debt and will likely need to issue more public debt. Ultimately, we believe the company will maintain a BBB+ rating and will solve issues with the Max program in 2020. We continue to position our fixed income portfolios with a defensive tilt. While we still believe in credit 5yrs and in, we have largely decreased spread duration by moving to treasuries 10-years and long.
High Yield
High Yield had a tough week, widening out a significant 30 bps, which was characterized by risk off sentiment from the coronavirus, weakness in energy, and increased supply, especially in the lower-rated tiers. Despite the 30 bps of widening, we’re only sitting 8 bps wide of year end levels. On Tuesday and Wednesday of last week, trading in high yield was characterized by chasing demand, followed by a large backtrack on Thursday and Friday.
Case in point, Netflix 2030 dated debt was well sought after early in the week, rising a point and a half on indicative quotes to 104.50. However, by the end of the week, it settled back down to 103.50, and we managed to pick up a small position. Going forward, new issuance will still be a focus as companies are seeking to take advantage of low rates to favorably refinance near term and high coupon debt. We still see primary issuance as the most attractive entry point into high yield. Deals have consistently been pricing past the low end of talk, but usually tighten in 5 to 10 bps off the break.
Energy
In Energy, commodity prices took a huge hit with WTI crude oil falling 7% and natural gas falling 5%. These declines have erased all gains the market has seen following escalation in the Middle East and phase one of the U.S./China trade deal. Prices will continue to greatly correlate with news surrounding the coronavirus and its potential to reduce demand. In 2003, the SARS epidemic reduced oil demand by 260 thousand barrels per day. We would expect prices to continue to fall throughout the week as new cases in new areas are seemingly being discovered daily. XLE, the S&P 500 Energy ETF is down over 5.5% year to date with 2.5% last week alone. The ETF is off 7% of 200 day moving average, the lowest level since early October. Entry points for some of the major players are not opening up just yet as Exxon, Occidental, and Baker Hughes are the leaders in the sector, but recent 4Q19 earnings givers Halliburton and Schlumberger are among the laggards in the sector.
This report is published solely for informational purposes and is not to be construed as specific tax, legal or investment advice. Views should not be considered a recommendation to buy or sell nor should they be relied upon as investment advice. It does not constitute a personal recommendation or take into account the particular investment objectives, financial situations, or needs of individual investors. Information contained in this report is current as of the date of publication and has been obtained from third party sources believed to be reliable. WCM does not warrant or make any representation regarding the use or results of the information contained herein in terms of its correctness, accuracy, timeliness, reliability, or otherwise, and does not accept any responsibility for any loss or damage that results from its use. You should assume that Winthrop Capital Management has a financial interest in one or more of the positions discussed. Past performance is not a guide to future performance, future returns are not guaranteed, and a loss of original capital may occur. Winthrop Capital Management has no obligation to provide recipients hereof with updates or changes to such data.