Midway through the Third Quarter – Gut Check
We are midway through the third quarter, and it is time to assess our portfolio structure and strategy.
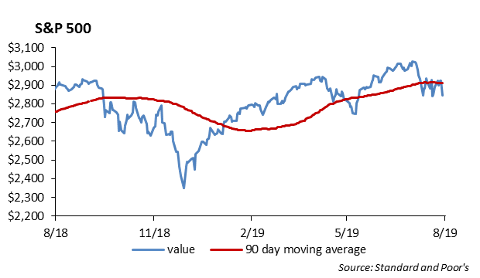
- Domestic equity has posted strong year-to-date performance with the S&P 500 up 13.4%. Market volatility has increased over the past month as global growth slows and the Trump Administration is fighting China with increased trade tariffs. At this point, we do not see an easy solution that allows China to continue to trade with the United States and, at the same time, continue its practice of intellectual property theft. Trump’s tweets last Friday in which he ordered U.S. corporations to relocate their operations out of China provide some insight into the current state of negotiations. We are expecting another volatile week this week.
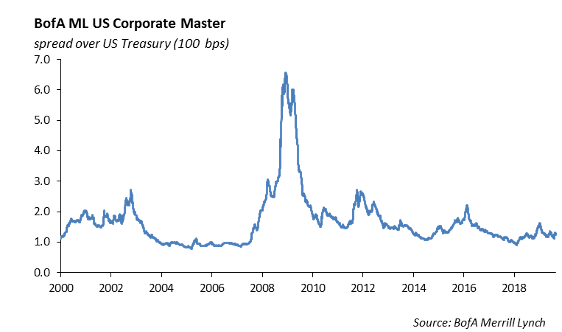
- Interest rates have fallen to historic low levels with the yield on the 10 year U.S. Treasury hitting a 1.47% yield. Credit spreads are holding in. Liquidity in the bond market over the past week has been mediocre.
- The United States Congress has used an unprecedented level of debt to plug the budget deficit for the past ten years. And, it will continue. The cumulative budget deficit over the past 10 years is over $8.7 trillion. This was funded through an increase in U.S. Treasury securities. Over the past 10 years, the Federal debt has increased by $8.3 trillion, which is a 70% increase. The amount of the increase in debt is equal to the TOTAL amount of U.S. Treasury debt outstanding in 2006.

- The amount of debt is growing at a significantly faster rate of growth than the U.S. economy.
- The real problem is that every developed country including Japan, Germany, France and the United Kingdom, are using the same monetary policy toolkit of low rates, quantitative easing and deficit spending in an effort to growth their economies. While it has been hugely expensive, it has not been wildly successful.
- Over $15 trillion of sovereign debt outstanding trades at negative interest rates. We are concerned that the global banking system does not operate effectively under negative interest rates. Japanese banks are of particular concern; however, European banks have deteriorated over the past two years. In addition, the life insurance industry is challenged to fund its liabilities with publicly traded assets at low and negative interest rates. The next financial crisis will not be a credit crunch, it will be a solvency issue related to funding. And, the countries that will need to step in to support the banks will be in debt up to their eyeballs due to the cumulative deficits they have monetized.
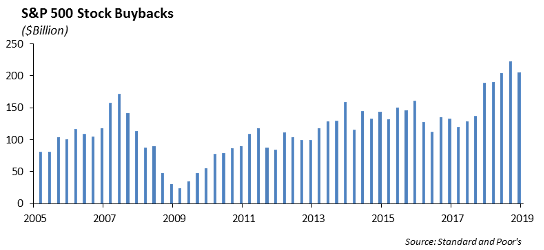
- At the same time, underlying fundamentals for corporations are deteriorating in our opinion. We expect to see an increase in lay-offs in the fourth quarter which will put pressure on the labor market. We consider this part of a normal business cycle and not a calamity. The binge on stock repurchase programs appears to have subsided in 2019 from prior years.
- Shifts in our asset allocation and Portfolio Models include:
- Adding to our broad market equity exposure on weakness
- Shifting large cap basis to low volatility strategies
- Reducing Financials and adding to the Defense/Aerospace and the Communications Sectors in our Sector Models
- Remaining underweight International and Emerging Markets exposure.
- Remaining short duration and overweight credit in fixed income
- Holding more cash in our model portfolios
- Reduce leverage-based products and securities in portfolios such as closed-end funds.
Equities
Stocks were on track to finish higher for the week until China unveiled a new round of retaliatory tariffs and President Trump vowed to respond, unnerving markets. In this new episode of escalation in trade tensions, China announced that it will impose tariffs ranging from 5% to 10% on $75 billion U.S. goods in two batches, effective on Sept. 1 and Dec. 15, including a 25% tariff on U.S. cars. While the Fed and trade dominate the headlines, it is important to note that economic and corporate data remain fairly positive. Earnings from several high-profile retailers last week were solid, indicating that the consumer – the main driver of the U.S. economic engine – remains in good shape.
Markets regained a bit of composure for most of last week. That limb wasn’t too tough to reach given the comparison is a frantic August in which the Dow rose or fell by more than 300 points in seven of the preceding 10 days. After rising for most of the week, a tariff-induced pullback late on Friday led U.S. stocks lower by 1.4%, extending August’s streak of weekly declines.
- The Dow ended the week -1.0% leaving it at 9.9% YTD
- The S&P ended -1.4% leaving YTD returns at 13.4%
Target shares soared 20% to a record of $103 after the company raised its earnings guidance for the year and reported that sales and profit rose in the second quarter. Lowe’s also reported higher profits, beating analysts’ estimates and pushing shares up 10%. After a slog of dampened sales, Dick’s Sporting Goods announced Thursday that same store sales jumped 3.2 percent in the second quarter — its strongest showing since 2016. The outdoor retailer’s stock surged more than 4 percent as Dick’s raised its full year guidance. The consumer-discretionary and technology sectors within the S&P 500 were the biggest winners this past week. The most-important positive feature of second-quarter U.S. GDP is that personal consumption expenditure jumped 4.3%, the highest since the fourth quarter of 2017, after growing a mere 1.1% in the previous quarter.
Fixed Income
The flight to quality trade is in full force as interest rates saw another week of declines. The 10-year treasury is now trading below 1.5%, and the 30-year is below 2%. The 2 to 10 year curve continues to close with positive steepness, but it has inverted intra-day several times. With all of the talk about inverted curves and whether this time is different, we recommend reading the work done by the New York Fed on treasury term premia (compensation for taking on duration) and their ACM model. Their model predicts that term premia is currently negative. This would imply that the treasury curve is much steeper than it looks and that due to low rates and deflationary risks, this time is different.
Corporate credit traded very sloppy during the week, and much of the street was either on vacation or flat out didn’t care to take a position in front of rising volatility. The new issue calendar was a complete ghost town during the week, and it’s expected that there will be no high yield or levered loan issuance over the coming week. Light issuance and an extremely large portfolio drove spreads tighter during the week. We were able to sell bank paper, which outperformed, but finding firm bids on tech names was challenging.
Municipal Bonds
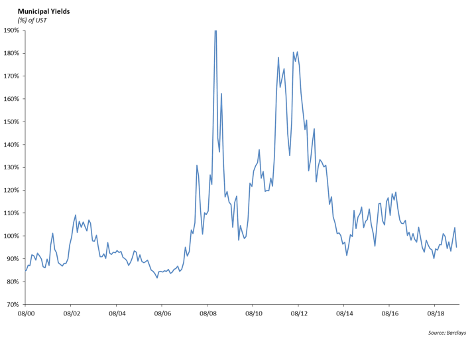
Muni’s underperformed treasuries during the week and yields across the curve actually increased. The 30-year muni/UST ratio currently is at 100%, marking the cheapest valuation of munis year to date. We believe investors should take this opportunity to move up in quality into high-rated munis as they generally experience less volatility than corporates in market dislocations.
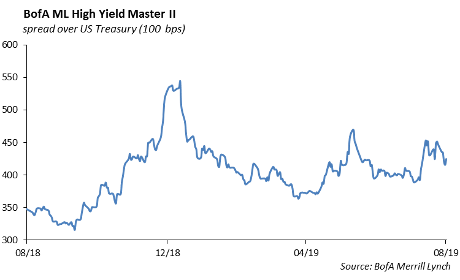
High Yield
The U.S. high yield index tightened 11 bps this prior week and we now sit 119 tight of YE2018 levels. We saw Bs as the option adjusted spread outperformer as BB’s tightened 10, B’s tightened 15, and CCC’s saw 7 bps of spread tightening. As far as total return is concerned, CCCs saw their first week as the leading outperformer for the first time since we moved to the second half of 2019. CCCs returned 65 bps due to longer duration and higher coupon rates, while Bs returned 48 basis points and BBs were the laggards with 43 bps of total return.
Despite the recent volatility of the market at large, the U.S. high yield debt market has remained pretty uneventful. New issuance has grinded to a halt, due to the volatility in the market as well as a historically quiet August with traders and many other professionals taking their end of summer vacations or “two-weekers.” New issuance is expected to be quiet until after Labor Day. Expect secondary spreads to remain highly correlated with equity markets as new information comes out about trade conflict with China or more tweets contemplating if the Fed Chairman is an “enemy of the state.” We favor investing high yield portfolios with very short duration BB names, while taking market volatility as an opportunity to pick up lower rated or longer duration securities cheap. A security we will keep an eye on is Tenet Healthcare’s 1st lien debt maturing in 2024. This credit has recently improved its debt structures with a series of refinancing’s but remains somewhat volatile and could be bought cheap with market uncertainty.
We are also looking at fixed income ETF flows. We’re seeing heightened volatility in inflows and outflows, even with big sign changing swings happening intra-weekly. High yield funds last week pulled in $1.1 billion in net assets, easily passing both the 1-year average inflows and year-to-date average inflows as investors are starting to move away from equity ETFs.
Portfolio Models
In models this week, we decided to take another step in moving to a more defensive approach to our sector strategies. In our Core Sector Series, we moved to underweight financials by reducing its weight to 12.20%, compared to the S&P 500’s weight of 13.20%. We also added 1.00% to consumer staples. This was reflected in our Tactical series models in which we have exposure to individual sector sleeves. We sold out of the XLF SPDR Financials ETF and added this weight back to SCHX as markets were. We still hold sleeves in Communications, technology, and Aerospace & Defense.

This report is published solely for informational purposes and is not to be construed as specific tax, legal or investment advice. Views should not be considered a recommendation to buy or sell nor should they be relied upon as investment advice. It does not constitute a personal recommendation or take into account the particular investment objectives, financial situations, or needs of individual investors. Information contained in this report is current as of the date of publication and has been obtained from third party sources believed to be reliable. WCM does not warrant or make any representation regarding the use or results of the information contained herein in terms of its correctness, accuracy, timeliness, reliability, or otherwise, and does not accept any responsibility for any loss or damage that results from its use. You should assume that Winthrop Capital Management has a financial interest in one or more of the positions discussed. Past performance is not a guide to future performance, future returns are not guaranteed, and a loss of original capital may occur. Winthrop Capital Management has no obligation to provide recipients hereof with updates or changes to such data.