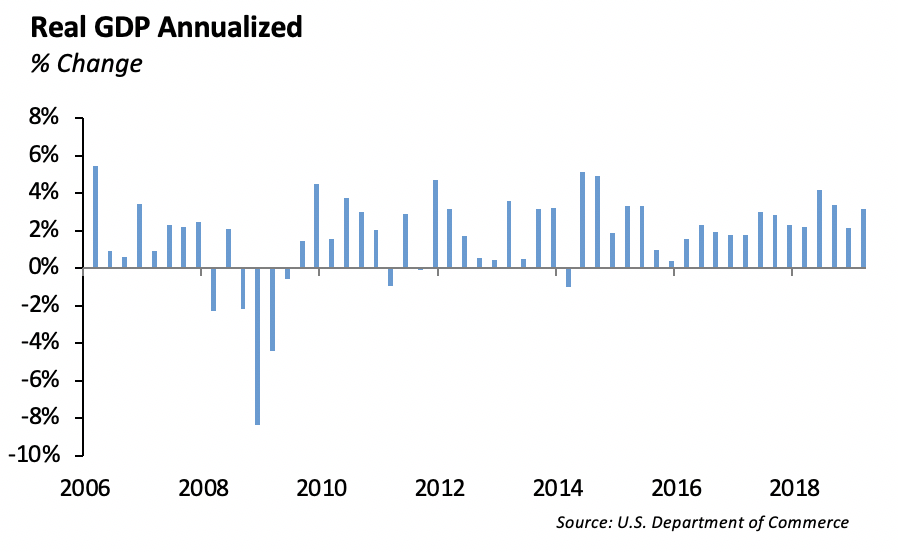
Economy Posts Strong Growth in 1Q 2019
The U.S. economy showed surprising strength as the GDP grew by 3.2% in 1Q 2019. This is the strongest first quarter growth in the past four years. The economy benefited from an improved trade balance and higher inventory investment.
In our opinion, the 1Q 2019 GDP figures included some anomalies which overstated headline economic growth. In 4Q 2018, U.S. companies increased imports ahead of potential increased tariffs with China, which didn’t materialize. As we had expected, consumer spending and business investment were weak for the quarter. When adjusted for trade, inventories and government spending, GDP growth appears closer to 1.8%. Housing sector was a drag for the fifth straight quarter, and consumer spending, which makes up over two-thirds of economic activity, increased a slight 1.2% in the quarter.
The quarter was marked by U.S. China trade difficulties, the government shutdown and some weather disruptions. The resolution of the U.S. China trade conflict will likely be a catalyst for growth in the second half of the year. In addition, the Fed’s shift to an accommodative tone in monetary policy will help lift asset prices.
Worth the Read
What was the last classic film you watched? Some in our office have reported “Ferris Bueller’s Day Off”. For our purposes, however, a classic movie has to be at least 50 years old. “Rear Window”, a classic Alfred Hitchcock movie with James Stewart and Grace Kelly was another mention. Last Thursday’s New York Times Business section had a great article titled Ban Netflix From the Oscars? The Academy Award rules require that films play in movie theaters in order to be considered for recognition. In today’s shifting world of media and streaming, that rule is becoming more and more difficult to apply.
Federal Reserve Remains on the Sidelines
The under belly of the 1Q 2019 GDP release will keep the Fed on the sidelines. We expect the Fed is concerned about the lack of inflation in the system. Inflation, measured by CPI, fell in the first quarter. CPI increased by 0.6% in the first quarter, and the Core CPI (which excludes Food and energy) rose 1.3%.
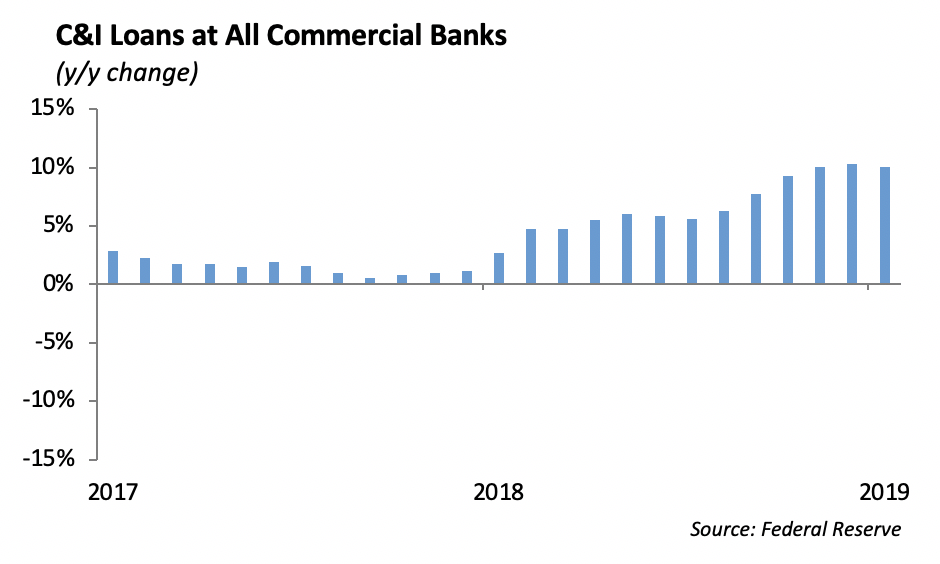
We are encouraged by the increase in bank lending over the past year. Private credit expansion is a critical component to economic growth. Over the past year, Consumer & Industrial loans increased by over 10%.
Fixed Income
Despite a continued equity rally, better than expected earnings, and solid economic data, interest rates fell over the past week. The 10-year US Treasury fell 6bps from 2.56% to 2.50% as of Friday. The entire treasury curve continues to steepen with the 2-10yr curve at 22bps, and the 2-5yr curve crossed into positive territory for the first time since January.
Investment grade spreads remained unchanged through the week at 110bps. Banks outperformed the market, particularly BBB issuers which were tighter by 3bps on strong earnings. New issuance was fairly light at 6billion during the week. However, one of our favorite traders, Netflix, issued 10yr bonds. Bonds came at +284/10yr, and despite a low concession, they traded 10bps tighter and are now bid at +274/10yr. Our top ideas in IG credit continue to be 30 year Boeing, 30 year 1st mortgage SoCal Edison, and 10 year on the run bank paper.
Municipal bonds continue to have a very strong year. The 10-year AAA muni/treasury ratio now stands at 76%, which is the tightest level on record. Municipal performance is an effect of increased demand driven by the cap to SALT deductions, decreased supply, and an increasingly aging population. While munis have become “technically” rich, we believe the fundamental drivers of performance will continue, and there are still opportunities. Currently, we favor school district and water/sewer revenue bonds, which provide 10-15bps of additional spread to the curve. The muni curve remains steep relative to treasuries. The 2-30yr muni curve is 108bps versus 65bps for treasuries, leading us to continue to favor the extension trade. Taxable municipals, which originally lagged the rally in corporate spreads, have tightened 23bps from their December peak. At current levels, taxable look fairly valued relative to corporate bonds.

High Yield
The US High Yield Index widened for the second consecutive week with spreads out 3 bps to 376 bps. Despite the spread widening, high yield saw a positive total return on the week at 0.18%. This positive performance was led by the risk tiers with CCCs returning 0.54%, Bs returning 0.17%, and BBs returning 0.11%. US HY total return YTD is now at 8.75%. Last week was the first in the past seven weeks that revealed negative outflows in high yield funds, with $521 million of outflows.
New Issuance picked up last week with $5.7 billion in US dollar denominated deals. YTD volumes are still down 4% from the comparable period last year. Notable US high yield issuance included United Rentals, which came with $750 million of 2030 senior notes, Netflix, which came with $900 million to fund content acquisitions, and Adient, the world’s largest auto seat manufacturer, which issued $750 million secured notes to prepay and terminate existing credit agreements. The Adient deal had received orders of about $5 billion, making the deal 7 times oversubscribed. Demand for HY issuance is strong.
With spread weakness, we are buyers of high yield paper while still favoring the relatively defensive BB space. Two names we are looking at this week include Equinix and Murphy Oil. Both are high yield names that are crossover credits with an S&P rating of BBB-. We see both as improving credits looking to be fully investment grade by late 2020, which will bring along further spread tightening due to technical bids.
Equities
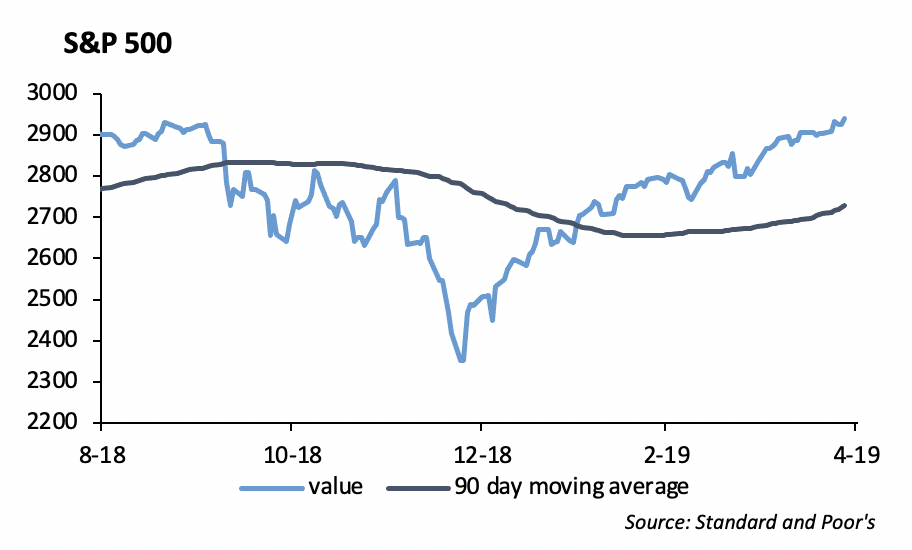
The S&P reached new highs last week and is up 17% YTD. NASDAQ also reached new highs and is up 22% in 2019. The DOW is up 15%. 46% of the companies in the S&P have reported results, and 77% have reported a positive EPS surprise, while 59% have reported a positive revenue surprise. The blended earnings decline for the S&P is -2.3%, which is an obvious improvement from last week’s -3.9%. Year over year, revenues are up 5.1%.
Quite a few companies made some noise last week with solid earnings reports, including TWTR, MSFT, and FB. Twitter saw first quarter revenue rise 20% year over year, to $787 million on earnings of $0.37 versus $0.15 expected. The big highlight was an 11% increase in year over year monetizable daily active users, rising to 134 million. Shares were up 12%.
Microsoft commercial cloud revenue and Office 365 commercial revenue increased 41% to $9.6 billion, accounting for 31.4% of total revenue. Total revenue was $30.6 billion, up 14% year over year and above the $29.8 billion estimate. EPS was $1.14 versus $1.00 estimate. Commercial cloud gross margin was up 5%, coming in at 63%, with the main driver being Azure, its cloud-computing business. Azure also saw its revenue rise 73% year over year. Shares were up 5%.
Facebook has received a lot of scrutiny over its security and privacy practices, but they proved deceleration was not as bad as expected. Revenue rose 26% year over year to $15.1 Billion on EPS of $1.89 vs. $1.63. Daily active users grew 8% year over year, and shares were up 7%.
UBER is now on the IPO calendar, and is pricing the week of May 6. The notable US IPO plans to raise $8.5 billion at a diluted market cap of $85.7 billion. After LYFT had its disappointing debut, Uber chose to set the midpoint of its range ($44-50) below its last private round. Even below its initial expectations of $100 billion, it will be the third largest US IPO by market cap.
Although Chinese equities have given back a lot of their gain, they are still the global out-performer. The Shanghai composite index dropped 6% last week, the worst week for Chinese stocks since October, yet it is still up 24% YTD. Chinese officials said they were less comfortable about adding stimulus after their stronger than expected 6.4% economic growth in the first quarter was reported. This will be a huge week for China as more than 60 companies in China and Hong Kong worth over $2.6 trillion will report today, including ICBC, China Construction Bank, PetroChina, Bank of China, and China Merchants bank. Other market catalysts include Hong Kong’s March trade data after market close, China manufacturing and non-manufacturing Purchasing Managers Index on Tuesday, and the next round of China-U.S. trade talks beginning Tuesday in Beijing. Chinese ETFs continue to outpace the S&P, as the IShares China ETF and the WisdomTree S&P China 500 Fund are up 21% and 26% respectively.
Portfolio Models
To start off the second quarter of 2019, we made several allocation changes to our Core Sector Models. As the global economic landscape seems to become more vulnerable to slowing growth, we’ve shifted our allocation to sector ETFs to reflect our outlook for the quarter. Our thesis remains that company earnings are experiencing slower growth.
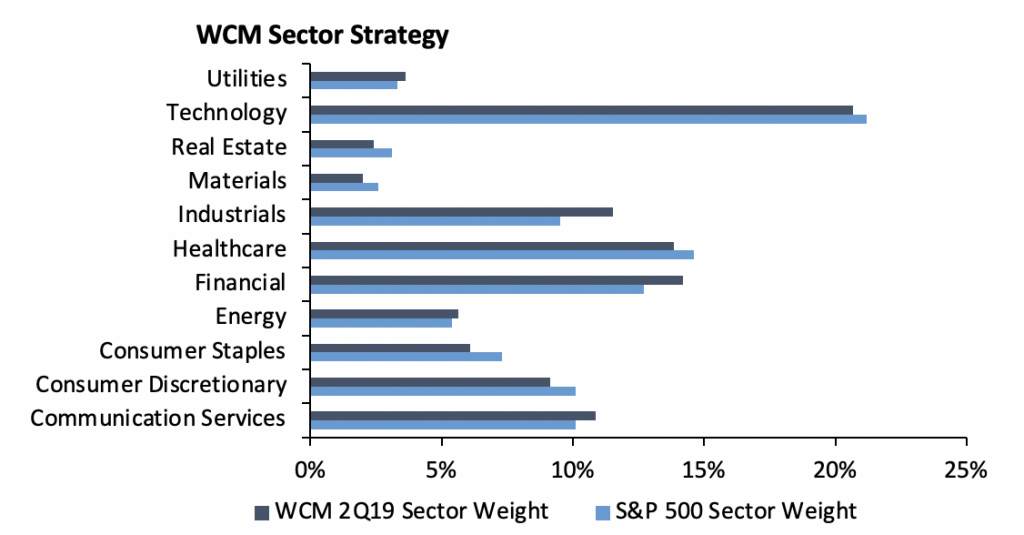
Changes we’ve made across our core sector models include the following:
- Added 2% to Communications Sector – We were underweight this sector last quarter, and the additional 2% brings our sector weight to 10.86% vs. S&P 10.10%. This sector offers value as the Media & Entertainment industry has continued to outperform. Disney is one company we are watching as it launches its proprietary streaming platform at the end of the year.
- Added 2% to Utilities Sector – The addition to utilities brings sector weight to 3.62% vs S&P 3.30%. As volatility picks up and growth slows in global markets, utilities offer an attractive safe-haven for reliable dividend payment in a more defensive strategy.
- Dropped 1% from Healthcare Sector – Allocation to the healthcare sector is now 13.83% vs S&P 14.60%. While we’ve been confident in healthcare in previous quarters, there are several headwinds that appear to be slowing the sectors outlook. Some of these headwinds include the possible removal of the ACA individual mandate, politicians going after higher drug prices, problems surrounding reimbursement pressures, and lingering questions around rebates.
- Dropped 1% from Real Estate Sector – Real Estate is now 2.41% vs. S&P 3.1%. As commercial real estate is likely in the later stages of the investment cycle and business credit conditions have trended down, we’ve moved allocation to underweight in this sector.
In other news, we recently created a new Income Model Series which seeks to generate consistent income and dividend payments to investors while also appreciating the investor’s market value across four risk tolerance models: Growth, Growth & Income, Moderate, and Conservative.
Looking forward, Chinese ETF offer a potential opportunity as we expect the Chinese economy will pick up after a settlement in the US-China Trade dispute. The country has already began offering stimulus to its slowing economy, and its impact on growth will likely become evident later this year. Meanwhile, leading indicators in the country are improving. Loan approvals typically lead loan demand, so a recent jump in approvals could contribute to greater demand and spending later in 2019. Therefore, we’ve begun analyzing eligible Chinese ETFs to add to our models’ international exposure in the future.
This report is published solely for informational purposes and is not to be construed as specific tax, legal or investment advice. Views should not be considered a recommendation to buy or sell nor should they be relied upon as investment advice. It does not constitute a personal recommendation or take into account the particular investment objectives, financial situations, or needs of individual investors. Information contained in this report is current as of the date of publication and has been obtained from third party sources believed to be reliable. WCM does not warrant or make any representation regarding the use or results of the information contained herein in terms of its correctness, accuracy, timeliness, reliability, or otherwise, and does not accept any responsibility for any loss or damage that results from its use. You should assume that Winthrop Capital Management has a financial interest in one or more of the positions discussed. Past performance is not a guide to future performance, future returns are not guaranteed, and a loss of original capital may occur. Winthrop Capital Management has no obligation to provide recipients hereof with updates or changes to such data.