March Data Confirms Sharp decline in Economy
We began 2020 with concern over growing evidence of a slowing economy. In spite of a strong labor market and small wage gains, the holiday shopping season had been below expectations, and the economy was struggling to hit 2% growth in GDP. We were concerned that corporate earnings would be challenged and there would be pressure on jobs as companies shed headcount to preserve margins. However, the coronavirus blew our expectations for the economy and earnings out the window.
The news of the coronavirus coming out of China was on our radar in late January, and we underestimated how the efforts required to control the spread of the virus would impact the economy and capital markets. In early March, there began coordinated efforts to close large gatherings such as the NCAA conference basketball tournament games. Then, the tsunami of business closings, including restaurants and nail salons, and other major sporting events the Masters, the Kentucky Derby and the Indianapolis 500. The government was swift to respond with aggressive monetary and fiscal stimulus. In March, the Federal Reserve announced a series of initiatives to back stop capital markets and buy bonds onto their balance sheet, which is designed to support liquidity in the credit markets. The fiscal response is largely borne by the CARE Act, will help provide much needed support to businesses and consumers.
Our framework to better understand the pandemic’s impact is to separate the impact on the economy, the financial system and the capital markets. We expect that movements in the capital markets will become less correlated with news on the economy, which will lag forward progress in recovery. In addition, the government’s fiscal response will ultimately be too slow to flow through the economy and will likely not be enough to bridge the gap between the current decimated economic environment and where we began the year. In this environment, investment decisions should be measured on valuations and not sentiment.However, determining earnings will prove difficult, particularly in those industries most effected by the virus such as hospitality, travel, and entertainment.
The next wave of the pandemic will force more difficult decisions.
- Last week, the state of Illinois asked Congress for $40 billion in bailout money, which includes $10 billion for its pension system. After Detroit and Puerto Rico have navigated difficult bankruptcies, which resulted from fiscal mismanagement that were decades in the making, it will be difficult to provide assistance to Illinois and its beleaguered pension funds known for their mismanagement. Next will be the state of New Jersey.
- April rent payments for commercial properties are the beginning of challenges that landlords will be facing. May and June payments will likely be down significantly. Shopping Malls, Strip Centers, retail businesses, restaurants, movie theaters, conference venues, and hotels are among the businesses that will struggle to pay next month’s rent. While the Payroll Protection Program was designed to help alleviate this challenge, we expect the problems businesses are facing are larger than their next rent payment.
- For many, the transition back to work will prove to be slower than expected. As a result, revenue will likely take longer to build. Plans for seating people at restaurants, riding subways, going to sporting events and getting hair styled will still have to be considered with social distancing protocol.
The Economy
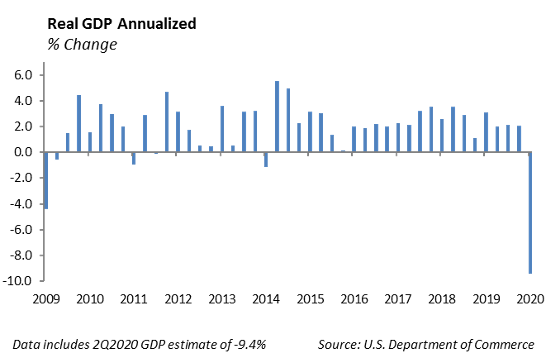
The devastating evidence of the impact from the coronavirus on the economy is beginning to show up in the March economic data. Unemployment claims spiked to an unprecedented 22 million people over a four week period. This dramatic shift in employment underscores the fragile structure of the economy with a large portion of the service industry that lives paycheck to paycheck with little savings to buffer a job loss.
Housing starts tumbled 22.3% and retail sales plummeted 8.7% in March according to the Commerce Department. These are by far the largest declines on record for this data. We expect April data will be just as devastating, and we expect 2Q 2020 GDP to be down as much as 9.4%.
One of the themes we are tracking is the risk that a large portion of business in the economy are represented by start-up companies. These companies emphasize growth in revenue over profits and continue to raise capital to finance operating expense as they burn through cash. When cash gets low, the hope is that revenue has grown significantly, which helps justify a higher valuation for the next capital raise. The research firm, Pitchbook, estimates over two million people are employed by venture capital backed businesses. We expect this sector will face significant challenges, raising new rounds in a difficult environment and forcing lay-offs to survive.
Equity
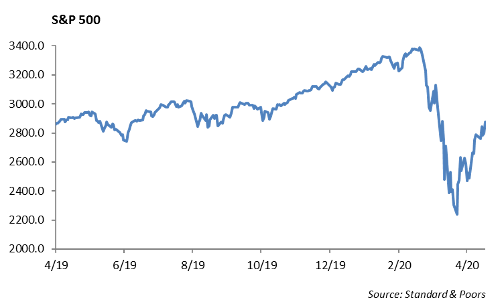
Last week, the S&P 500 rose another 3% up to 2874, representing a 27% rally off of lows. The rally has lasted 18 trading days, bringing the S&P to 16% off of the highs. Given the increase in equity prices, we are looking to reduce equity basis in balanced portfolios and Portfolio Models.
EARNINGS
For the first quarter of the year, consensus earnings are expected to decline 9%. So far, 21 companies in the S&P 500 have reported, 76% of which have beaten earnings estimates. In addition, 71% of companies have beaten revenue expectations.
- JPMorgan (JPM): Profit came in well below expectations, with an earnings per share (EPS) of $0.78 versus $1.84 estimate. They added $6.8 billion to loan loss provisions as they expect a surge in defaults across credit cards, real estate and retail. The company’s revenue reported at $29.07 billion, dropping only -3% year over year. The trading division, however, posted a record 32% increase in revenue up to $7.2 billion. Trading revenue from bonds was $5 billion, which beat by $1 billion, and revenue from equities were $2.2 billion. The company’s stock (JPM) is down 32% year to date.
- Citigroup (C): Citigroup also posted a large decline in first quarter profits as EPS was $1.05 versus $1.87 estimate. Loan loss reserves are up to $4.9 billion. Revenue was actually up 12% to $20.7 billion, due to a higher volume in fixed income and equity trading, bringing a 39% increase in revenue. The company’s stock (C) is down -43% year to date.
- Morgan Stanley (MS): Morgan Stanley’s first quarter dropped – 30% to $1.01 a share versus $1.14 estimate. The company reported a revenue of $9.49 billion, slightly missing estimates. The wealth management division declined -8%, and investment management revenue fell -14%. Trading revenues were strong with revenue up 30%. Revenues from fixed income trading was $2.2 billion, which beat estimates by $500 million. The company’s stock (MS) is down -24% year to date.
EARNINGS CALENDAR FOR APRIL 20TH TO APRIL 24TH:
- Tuesday (4/21): Coca-Cola, Lockheed, Procter & Gamble, Netflix, Texas Instruments
- Wednesday (4/22): AT&T, Boeing, Kimberly-Clark, Thermo Fisher, FB, MSFT, PYPL, Visa
- Thursday (4/23): Lilly, Illinois Tool Works, Amazon, Intel
- Friday (4/24): Verizon, Zimmer
WCM STRATEGY CHANGES
Last week, we provided an update on our sector views and the shifts made to our Core Sector Series. We are implementing these allocation changes to our Large Cap Blend strategy. Most recently, we have added additional exposure to Information Technology through Salesforce (CRM). We reduced exposure in Industrials by selling out of Cummins (CMI) and CSX Corporation (CSX). We have reduced our Energy exposure by reducing our position in ConocoPhillips (COP). We have raised our exposure to Utilities by adding to Duke (DUK) and to DTE Energy Co (DTE). Finally, we are currently looking at names to increase exposure to Healthcare, such as UnitedHealth Group Inc (UNH).
Fixed Income
Interest rate volatility has remained suppressed over the past week. The MOVE Index has returned to normality at 69, while the 10-Year U.S. Treasury remains below 0.70%. Yields across the globe remain low, with $10 trillion remaining in negative territory. Given the amount buying of government bonds by central banks, it is surprising that we have not yet seen a retest of Treasury yield lows. Regardless, we believe there is a natural ceiling for rates to increase in the near term.
Credit markets continue to be dominated by new issuance activity, with $54 billion issued last week, and a similar amount is expected in the upcoming week. New issue concessions have begun to fall, but at 18 bps, offers are still considerable premiums relative the past few years. Ford was the biggest issuer last week at $8 billion, issued around 9% depending on the maturity. Performance of newly issued bonds continues to be very strong.
Municipal bonds have posted a strong performance so far in April. The yields on the Bloomberg Municipal Index have fallen from a peak of 3.50% to 1.92%. While the drop has been sharp, municipals are still trading with a considerable spread to U.S. Treasuries at current levels. For investors in high tax brackets and looking for lower volatility income, we continue to favor municipals in the 3-10 year section of the curve.
High Yield
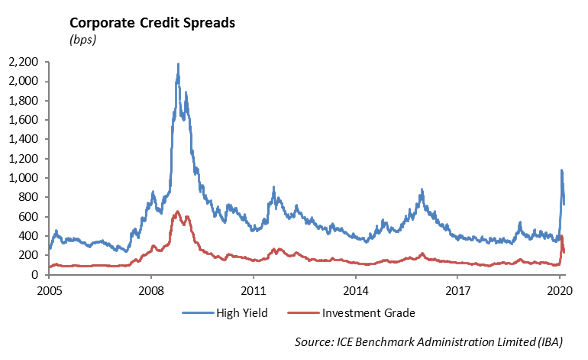
Credit markets had another positive week last week. Investment grade credit tightened 27 bps, while high yield tightened 65 bps. In both indices, higher-risk credit far outperformed quality, with BBBs outperforming AAAs by 30 bps, and CCCs outperforming BBs by 70 bps. Year-to-date, the investment grade credit index has recovered to positive returns and is up 0.72%. The front of the curve has outperformed in both the investment grade and high yield index. Credit curves have moved from mostly flat curves to a 51 bps pick up from 1-3 year investment grade credit to 10 year investment grade credit. When compared to the typically 100 bps of steepness in the credit curve, there is still value to be found here.
High yield is now 370 bps wide of year-end 2019 levels. Year-to-date, high yield is down -8.50% total return, with meaningful dispersion among risk tiers. BBs are only down -4.75%, while CCCs are down a whopping
-20.25%. For total return last week, Bs modestly outperformed the rest of the index at 2.65%. High yield funds saw a $7.66 billion inflow to ETFs and mutual funds last week.
The high yield primary market saw more than a dozen issuers, offering more than $7 billion in volume. The issuers focused in the high-quality space from BB to B rated companies. Ford, as a newly rated BB company, offered $8 billion of 3-year, 5-year, and 10-year bonds. The offering was used to restore liquidity to the company after estimates show they are running a -$5 billion monthly cash burn while production is in full shut down. The offering saw huge amounts of demand. Even after upping the offering from $3 billion to $8 billion, the deal was about 5 times oversubscribed.
Energy
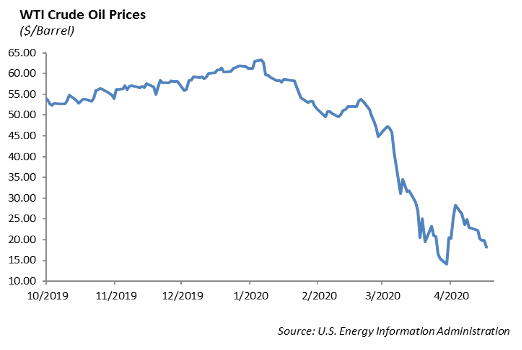
WTI crude oil fell over -$4.50 per barrel, or -20%, last week, and Monday morning April 20th, WTI crude oil is down a monumental -37% to $11.65/bbl. These sharp declines seem to be catalyzed by two primary causes: technical pressures and major oil surpluses. There are technical pressures, as May contracts are set to expire after today’s session. June and future months are still priced at around $20/bbl. Second, despite a -13% drop in US rig count and the recent cuts by OPEC+, oil supply is still at a glut. U.S. crude inventories are 6% above the five-year average. Storage space for excess crude oil is beginning to dwindle, and demand shows no sign of picking up. The recently published IEA Oil Market Report estimates that global oil demand will decline by over 9.3 mbd year over year in 2020.
This report is published solely for informational purposes and is not to be construed as specific tax, legal or investment advice. Views should not be considered a recommendation to buy or sell nor should they be relied upon as investment advice. It does not constitute a personal recommendation or take into account the particular investment objectives, financial situations, or needs of individual investors. Information contained in this report is current as of the date of publication and has been obtained from third party sources believed to be reliable. WCM does not warrant or make any representation regarding the use or results of the information contained herein in terms of its correctness, accuracy, timeliness, reliability, or otherwise, and does not accept any responsibility for any loss or damage that results from its use. You should assume that Winthrop Capital Management has a financial interest in one or more of the positions discussed. Past performance is not a guide to future performance, future returns are not guaranteed, and a loss of original capital may occur. Winthrop Capital Management has no obligation to provide recipients hereof with updates or changes to such data.