Fiscal Stimulus
Congressional Democrats and Republicans reached a $900 billion fiscal stimulus deal this past weekend. While it provides much needed support to the economy, it is not the same panacea as the first stimulus bill. We believe this fiscal initiative is too late to avoid the slowdown already gripping the labor market and the reduction in consumer spending weighing on the economy. Assuming the bill is approved by Congress, the deal will provide $325 billion to small business, $120 billion for federal job benefits that will last 11 weeks, and $166 billion for direct payments to individuals who earn $75,000 or less annually. It will also provide aid to airlines and transit agencies, including New York’s MTA. While this will provide a needed to boost to the economy, we believe the stimulus falls short and leaves the underfunded state and local governments exposed to further distress next year.
Equity Market Valuation
During the past year, despite the pandemic, the large-cap technology stocks, including Apple, Facebook, and Amazon, helped drive the equity markets to new highs. Next year, we do not expect Technology to continue to drive the market. Instead, we foresee a shift away from Technology toward cyclical and more down beaten companies that were affected by COVID-19 to lead the market. We anticipate a recovery to take hold in the economy in the second half of 2021 and for corporate earnings to reflect that recovery. At the same time, however, market returns will likely be more muted, given that a lot of gains have already been pushed forward this year on the expectations of the success of the vaccine and reopening of the economy.
By traditional measures, including the price/earnings ratio, the valuation of the equity market is on the high side. Assuming trailing 12-month earnings on the S&P 500 of $98.80 and the S&P 500 trading at 3680, the trailing 12-month P/E ratio of 37.27x is near its highest level since the dot-com bubble in 1991. If we assume a forward 12-month earnings of $155 of the S&P 500, the P/E ratio is near 23.75 times. And, if we bump projected earnings to $170, the P/E ratio settles in at 21.6 times, which is still on the high side of historical measures. Fiscal and monetary stimulus will likely help support these extended valuation multiples for the time being.
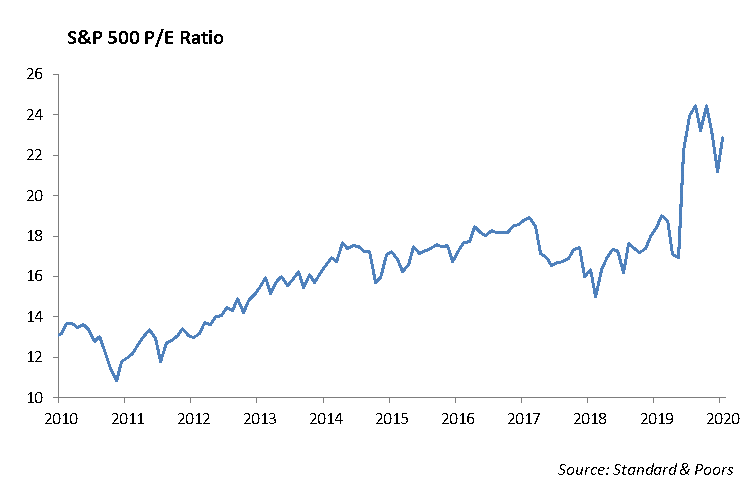
We expect the S&P to trade to 3850 next year, which is roughly 4.5% price appreciation over current levels. Until we transition from multiple expansions to real earnings growth to support these elevated levels in the equity markets, we expect returns to be lower than the past several years. Given current valuations, we currently like the Financial, Healthcare, Consumer Discretionary, and Technology sectors.
Stocks for 2021
Live Nation Entertainment (LYV) stock has actually had a pretty good run this year in spite of not having a single act touring. The company typically has 25 major acts touring in a single year. They have so far announced 15 major acts touring in 2021 and 45 touring in 2022. There will be a lot of music after the pandemic.
Madison Square Garden Entertainment (MSGE) owns the Madison Square Garden arena in New York. The stock price has lagged LYV, and the company has net cash of nearly $1 billion. Much of the cash is being used to build the Sphere, a new state-of-the-art concert venue in Las Vegas. Bookings for 2021 for Madison Square Garden are running 50% ahead of this past year.
Fixed Income
Interest rates continued to drift higher last week. The 10-year U.S. Treasury ended the week at 0.95%. Despite the near-term increase in rates, U.S. Treasuries have been the best-performing asset class within fixed income. Generally, rates are down 100 bps year-over-year, leading to a total return of long duration treasuries of more than 17%.
Conversely to treasuries, credit experienced heightened volatility through the first quarter but has performed well since. Across fixed income, it is difficult to identify a sector or asset class that did not perform well this past year. The Bloomberg Barclays U.S. Aggregate Index is up 7%, and investment-grade credit, likewise, is up 10% in 2020. Lower- grade credit had the most difficult year but is still positive for 2020. CCC credit and levered loans were down more than 20% in March. Both sectors have since recovered; the Bloomberg Barclays High Yield Index is up more than 6%, and levered loan index up 1% in 2020. Agency MBS has produced a stable 4% return. Frankly, the only thing that didn’t work in fixed income markets this year was low-grade energy debt. High-yield oil-field services are down 30% year-to-date, due to increased bankruptcies and decreased recovery rates.
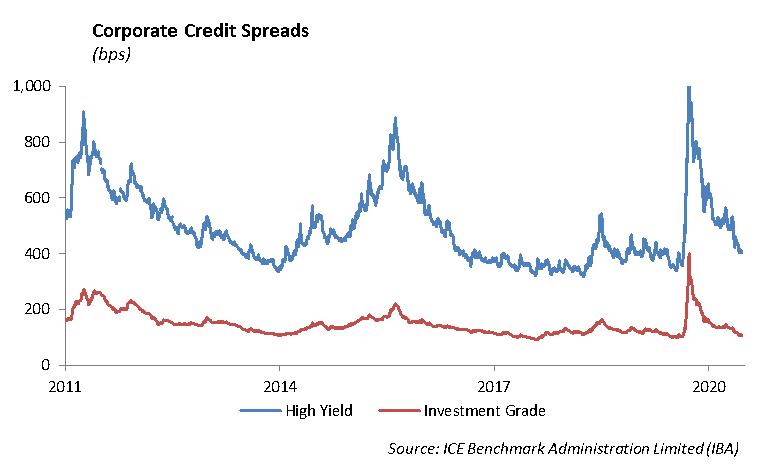
With yields and spreads at historically low levels, we have begun looking outside of traditional credit to build and invest portfolios. We continue to diversify our fixed income portfolios and add to our structured securities allocation which provides incremental spread with lower duration and less credit risk. We want to remain defensive in our bond portfolio by remaining short our benchmark duration and maintaining a high level of liquidity to allow for reinvestment in the event there is a market dislocation.
This report is published solely for informational purposes and is not to be construed as specific tax, legal or investment advice. Views should not be considered a recommendation to buy or sell nor should they be relied upon as investment advice. It does not constitute a personal recommendation or take into account the particular investment objectives, financial situations, or needs of individual investors. Information contained in this report is current as of the date of publication and has been obtained from third party sources believed to be reliable. WCM does not warrant or make any representation regarding the use or results of the information contained herein in terms of its correctness, accuracy, timeliness, reliability, or otherwise, and does not accept any responsibility for any loss or damage that results from its use. You should assume that Winthrop Capital Management has a financial interest in one or more of the positions discussed. Past performance is not a guide to future performance, future returns are not guaranteed, and a loss of original capital may occur. Winthrop Capital Management has no obligation to provide recipients hereof with updates or changes to such data.
© 2020 Winthrop Capital Management