Economic Update
We have maintained that the labor market is the key to a sustained recovery in the economy. Small business historically drives labor. Small businesses include restaurants, nail salons, barber shops and lawn care companies. Many small businesses are caught in the grip of this pandemic and owners are unable to pay rent and employees without government assistance. Business models that rely on high density and customers gathering shoulder to shoulder are simply not working. We expect a continued increase in bankruptcy filings heading into the end of the year.
Roughly 870,000 people filed for unemployment last week as progress putting people back to work slows and the rate of unemployment remains at 8.4%. We expect the job market to be difficult as restaurants relying on outdoor dining face colder weather. In addition, we expect to see an increase in white collar lay-offs heading into year- end as companies strive to maintain profit margins.
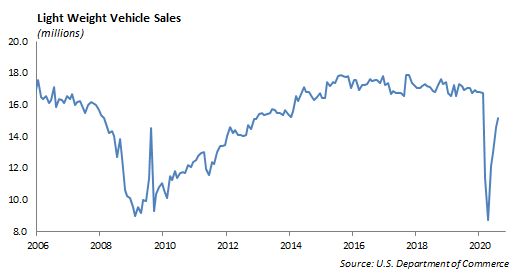
Auto sales are released this week, and we expect roughly 15.5 million SAAR for September. That is lower than the 17.3 million a year ago. Tesla is expected to report Q3 deliveries this week, and we expect they will challenge their previous quarterly record of 112,000 in 4Q 2019.
Portfolio Models
The phrase “new normal” was coined during the Financial Crisis as a way to describe changes in the economy and capital markets that would likely persist. Today, we have something akin to the “next new normal.” Investors are navigating through a global pandemic and experiencing everything from social distancing, furloughs, lay-offs, to masks, and curbside pick-up. We expect to continue living like this through most of 2021. The economic recovery will be slow.
The strong rally in stocks and bonds masks underlying risks. The S&P 500 was at one time a diversified index; however, now the five largest stocks represent 20% of the market value of the index. The growth in the large technology companies is distorting the structure of the index and its risk. Here are a few examples.
Financial Sector
The three largest companies in the Financial Sector of the S&P 500 are Berkshire Hathaway at 15.9%, JP Morgan at 10.8% and Bank of America at 6.8%. Berkshire Hathaway’s largest holding is Apple at 44%. Simplistically, if we look at Berkshire Hathaway as a mutual fund, the value of Apple stock has a significant impact on the value of Berkshire Hathaway. That translates into the Financial Sector of the S&P 500 having 7% exposure to Apple stock. This would make Apple, a technology company, the third largest holding in the S&P 500 Financial Sector!
Consumer Discretionary
The three largest companies in the Consumer Discretionary sector of the S&P 500 include Amazon at 23.1%, Home Depot at 12.1% and McDonalds at 6.8%. Amazon is nearly one-fourth of the entire consumer discretionary sector. Yet, one of the fastest growing parts of Amazon is its cloud business, Amazon Web Services (AWS). Year to date, AWS produced $6.4 billion in income. This represents 65% of total $9.8 billion in operating income. A technology company hidden inside the Consumer Discretionary sector. Amazon announced Prime Day is October 13th, 2020.
The SPDR Select Consumer Discretionary ETF has underperformed the S&P 500 consumer discretionary index by 5% in 2020. The underperformance is largely due to a significant difference in allocation to Amazon. While the ETF has 23% allocated to Amazon, the index has 41% allocated to the stock.
Equity
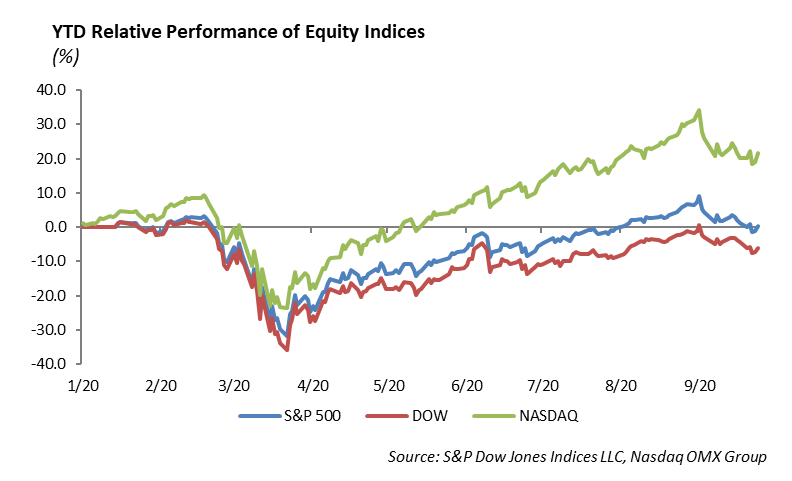
The S&P was down -0.63% last week and ended over 8% off all-time highs. The index is up 3.48% year-to-date, with the top 5 stocks in the S&P having contributed 9.48% to that return. The NASDAQ was able to break its streak of weekly declines, rising 1% last week. It is up 21% year-to-date and is trading about 8% off all-time highs. The DOW was down -1.75% and is now down over -4% year-to-date.
We are in between earnings seasons, but there are still some companies reporting. Last week, Nike beat results easily. The transition to online retail continues to be strong.
Nike (NKE)
Nike reported earnings of 95 cents versus 47 cents expected. Revenue for the quarter was $10.59 billion versus $9.15 billion expected. Sales in North America were down -2%, but they were up 6% in China. This was a recovery from the big miss in revenue that Nike had last quarter, where revenue fell over -30%. Athletic retailers have found much more success than their peers. Peloton, Lululemon, and Nike have all broken the retail trend. Due to COVID, digital sales rose 82%. Digital sales now make up over 30% of Nike’s sales, which meets their goal for 2023. The women’s apparel division was a big driver, as it rose 200%. Shares were up over 10% on its earnings release. Year-to-date Nike, shares are up 23%.
Fixed Income
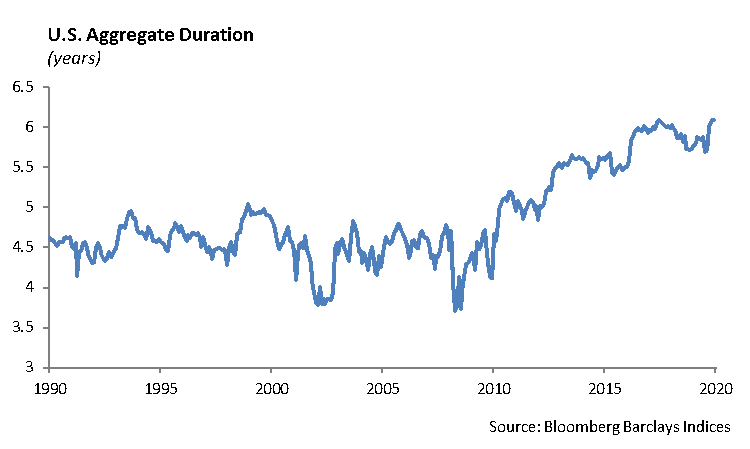
Much like equity indexes, fixed income indexes have changed significantly due to market changes, increased leverage, and historically low interest rates. Many investors let indexes dictate their investment strategy rather than their investment objectives. While the Bloomberg Barclays US Aggregate Index had an average duration of 4.5 years from 1992 to 2012, it has since extended sharply to now 6.05 years. Passive investors continue to take on more and more duration risk, with lower yields to compensate for market fluctuations. The corporate bond index has extended even further from 4.5 years in 1992 to now 8.10 years.
As more and more companies have levered up due to low interest rates, BBB corporates have become a larger part of indexes. BBB corporates now make up 15% of the US Aggregate index and 49% of the corporate index. The biggest risk to the index is that there is a higher risk of companies being downgraded to high yield, leading to their removal from the index. This forces selling that truly hurts all investors.
We are often asked who buys negative yielding debt. While there are many different reasons for an investors to buy negative yielding debt, index investment mandates are one reason. With over $15 trillion in negative yielding debt, over 10% of the Global Aggregate Index has a negative rate. Many pension funds and endowment IPS’s call for investments that track indexes. Global mandates generally force investors to buy these securities regardless of whether they are a sensible investment or not.
We encourage investors to look beyond simple indexes as their framework for investing. Investing should be based on risk tolerances and return objectives, not what an index tells them to buy.
This report is published solely for informational purposes and is not to be construed as specific tax, legal or investment advice. Views should not be considered a recommendation to buy or sell nor should they be relied upon as investment advice. It does not constitute a personal recommendation or take into account the particular investment objectives, financial situations, or needs of individual investors. Information contained in this report is current as of the date of publication and has been obtained from third party sources believed to be reliable. WCM does not warrant or make any representation regarding the use or results of the information contained herein in terms of its correctness, accuracy, timeliness, reliability, or otherwise, and does not accept any responsibility for any loss or damage that results from its use. You should assume that Winthrop Capital Management has a financial interest in one or more of the positions discussed. Past performance is not a guide to future performance, future returns are not guaranteed, and a loss of original capital may occur. Winthrop Capital Management has no obligation to provide recipients hereof with updates or changes to such data.
© 2020 Winthrop Capital Management