More Money
Saturday the Senate passed President Biden’s fiscal stimulus package designed to provide support for households and small businesses. The next step is to go back to the House on Tuesday for a final vote. Totaling an expected $1.9 trillion, this is the third stimulus package post- pandemic and comes on the heels of Trump’s $900 billion stimulus package last December.
Our base case for 2021 remains that we expect an acceleration in GDP the second half of 2021, and unemployment will fall sharply as demand for workers increases and the economy opens up.
In addition, reducing the temperature on trade disputes between the United States and Europe should help economic growth of both countries.
The Emerging Market Trap
Thirty years ago, MSCI rolled out its Emerging Markets Index. It was a useful tool to diversify portfolio asset allocation and gain exposure to smaller countries within the international space. Today, it represents a trap for investors who believe it’s the same investment it was in the 1990s and 2000s. The MSCI Emerging Markets Index has concentration risk issues around country exposure and single-issuer exposure, which distort comparisons from earlier periods. In addition, the classification of China in a market-weighted index is problematic given the size of China’s economy today.
When MSCI first launched the Emerging Markets Index, Malaysia was the largest country with a market weight of 29.5%, Brazil was second-largest at 25.5%, and Mexico was third at 10%. In total the three largest countries represented 55% of the Index. China was added to the index in 1996. In 2006, the three largest countries in the Emerging Markets Index were Korea 15.5%, Taiwan at 12.5% and China at 11.8% totaling 39.8% of the total index.
Over the past 30 years, the MSCI Emerging Markets Index has added to its constituent countries, and its market capitalization has grown from a meager $15 billion in 1988 to more than $8.1 trillion today. The three largest countries are the same as in 2006, however the index has grown significantly more concentrated. China represents 39.5%, Taiwan represents 13.8%, and South Korea accounts for 13.2%. In total the three largest countries represent a staggering 67% of the index.
Initially a way to invest in smaller countries with growing economies, today the MSCI Emerging Markets Index is dominated by Asian countries. In fact, the countries that were represented in the original index in 1988 now represent less than 20% of the market value of the index.
From December 31, 2000 through the end of February 2021, the weighted average annualized return of the MSCI Emerging Markets Index is 9.71%. However, during the past 10 years, the annualized return is 4.41%. The structural changes to the index are so great that any reversion to the mean comparison is meaningless. It’s like driving the Indianapolis 500 and switching to a totally different race car every 100 laps, then trying to determine how the car performed during the race.
The second issue concerns classifying China as an emerging market. When China was first included in the MSCI Emerging Market Index in 1996, its economy measured by nominal GDP was a mere $863 billion. At the same time the US economy was $8 trillion and Japan was $4.8 trillion. Today, the GDP of China is $14.3 trillion compared to the U.S. at $21 trillion and Japan at $5.1 trillion. China is the second-largest economy in the world.
We are addressing the changing makeup of the emerging markets by pulling out China as its own sleeve, so we can isolate it from the smaller countries in the index.
Equities
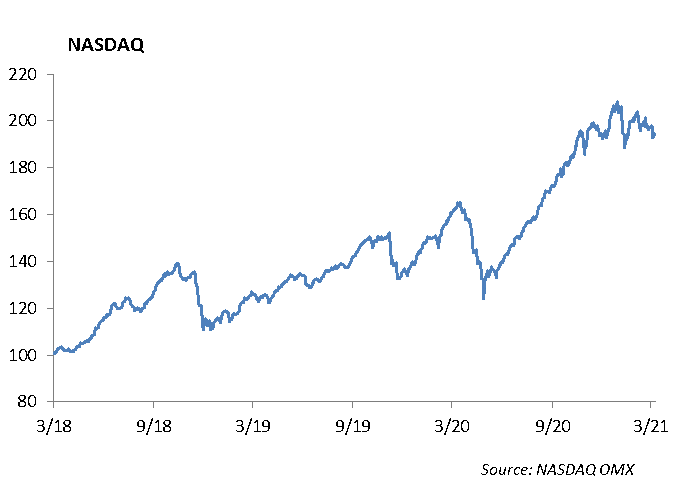
The rotation out of technology continued last week, as the NASDAQ fell about -2%, bringing its 2-week loss to -7%. The index is now over -8% off of all-time highs. Similarly, the rotation is evident in S&P sector performance, as there are now 7 sectors outperforming Technology year-to-date. Energy and Financials are currently leading the pack, up 38% and 14%, respectively.
Earnings season has unofficially ended, and although expectations have been quite low all year, the historical comparisons are staggering. 2020 provided us with three of the strongest earnings and revenue beat rates in history, with an average of over 75% of companies beating expectations. Additionally, guidance raises have been fairly strong. Tech provided the strongest beat rates which, given its recent underperformance due to the spike in interest rates, could help offset the extreme moves in the sector.
Target [TGT]
Target shares were up about 1% after beating their fourth quarter earnings and revenue estimates. Earnings per share was $2.67 vs. $2.54 expected. Revenue was $28.34 billion vs. $27.48 billion expected. Revenue was up 21%. Comp sales were up 20%, with digital comparable sales rising 118% year-over-year. Both combined traffic and average ticket grew by 6.5% and 13.1%. Curbside pickup and Shipt, their delivery service, grew 212%. Target continues to steal market share from struggling retailers, Macy’s and Kohl’s. Trailing 12 months, shares are up 81%. We continue to believe Target is a dominant player in the consumer sector, and the company shows no signs of slowing down in the near-term.
Fixed Income
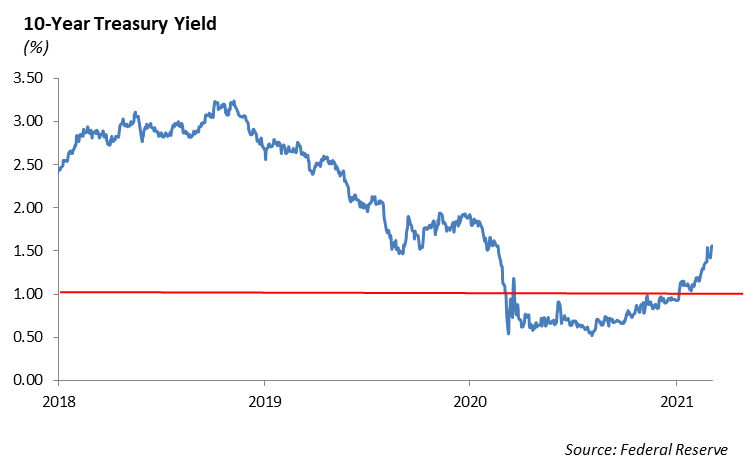
Volatility across U.S. Treasury markets continued through last week. The MOVE index, which measures interest rate volatility, is now up 50% over the past month. While the 10-year U.S. Treasury, at 1.50%, is meaningfully higher over the past two months, it is important to look at a broader perspective. Just over one year ago, the 10-year was trading near 2%. Unlike equity and credit markets, interest rates in the U.S. have lagged the so-called “economic recovery.” Inflation risks are legitimate, as congress moves closer to passing another round of stimulus. While it is likely that we see inflationary pressure in the near-term, we still believe it will be difficult to spark sustained inflation above 2% in the U.S.
Credit spreads finally began to widen last week as equity volatility increased. New issuance increased slightly but is still muted year-over-year. Secondary trading was very difficult. Money managers seemed to be sitting on their hands and not taking positions as interest rate volatility increased. The slight lack of liquidity made it difficult to both buy and sell bonds, leading to spreads widening 5-10bps depending on the sector.
This report is published solely for informational purposes and is not to be construed as specific tax, legal or investment advice. Views should not be considered a recommendation to buy or sell nor should they be relied upon as investment advice. It does not constitute a personal recommendation or take into account the particular investment objectives, financial situations, or needs of individual investors. Information contained in this report is current as of the date of publication and has been obtained from third party sources believed to be reliable. WCM does not warrant or make any representation regarding the use or results of the information contained herein in terms of its correctness, accuracy, timeliness, reliability, or otherwise, and does not accept any responsibility for any loss or damage that results from its use. You should assume that Winthrop Capital Management has a financial interest in one or more of the positions discussed. Past performance is not a guide to future performance, future returns are not guaranteed, and a loss of original capital may occur. Winthrop Capital Management has no obligation to provide recipients hereof with updates or changes to such data.
© 2021 Winthrop Capital Management