The Economy
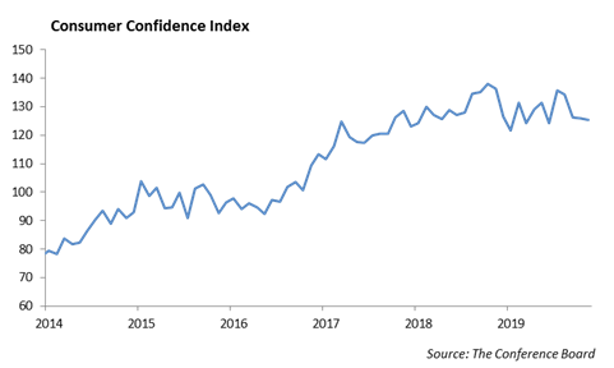
In a pleasant surprise last week, GDP growth for the third quarter came in at 2.1%, slightly stronger than the 1.9% we expected. At the same time, consumer confidence fell in November, its fourth straight month in decline. This highlights concerns for both business conditions and employment heading into the holiday shopping season. While we are expecting a strong holiday shopping this year given the low unemployment and modest wage growth, the surprise move would be to the downside. Deterioration in new home sales and consumer confidence last week also underscore concerns we have with the consumer sector.
In a speech last week, Federal Reserve Chairman Powell indicated, “Monetary Policy is now well positioned to support a strong labor market and return inflation decisively to the 2% target. At this point in the long expansion, I see the glass as much more than half full.” We expect the Fed to remain on hold with the current level of short term rates. The health of the consumer sector will be critical to 2020 economic growth.
The holiday shopping season is off to a strong start with online sales of $7.4 billion reported on Black Friday according to Adobe Analytics. This is up from $6.2 billion in online sales last year.
Worth The Read
This week’s issue of Barron’s has a wonderful article called “Tough Times for Tech Pioneers” by Eric J. Savitz. The article discusses the demise of legacy tech companies and their struggle to stay relevant as the industry shifts to a business model of subscription based services and the cloud, artificial intelligence, and data analytics. The table titled “Evolution of Tech Giants” lists the top 15 technology companies by market cap at the beginning of each decade, starting in 1980 with IBM the largest at $37.6 billion. Today, Apple is the largest at $1.17 trillion, and IBM isn’t even on the list. Eastman Kodak was number two on the list in 1980.
Five Stock Picks for 2020
- Microsoft Corp. (MSFT)
Microsoft provides development and support of software, services, devices, and solutions. MSFT operates in three main business segments: Productivity and Business Processes, Intelligent Cloud, and More Personal Computing. We expect solid growth to continue across all major segments, particularly its cloud business and integration of its GitHub acquisition last year. MSFT has expended its product and services foot print to cover a large piece of the commercial and consumer market for software and services.
Now removed from the more structured, risk averse culture from a decade ago, the company appears to be operating efficiently, with gross margins over 65% and operating margins near 34%. The company has a return on invested capital of 23%, a market capitalization of $1.2 trillion, and debt to asset ratio of 30%. With MSFT trading near its 52 week high, its valuation is pretty full. With earnings for 2020 near $5.36 and revenue growth of 13%, the stock trades near a 26.5x P/E multiple and 22.4x Price/Cash Flow multiple. With a dividend of $2.04, the stock has a dividend yield of 1.35%. With a payout ratio of 38%, there is room to move the dividend higher.
- Lockheed Martin (LMT)
Lockheed Martin is a global security and aerospace company, which engages in the research, design, development, manufacture, integration, and sustainment of technology systems, products, and services. It operates through four main business segments: Aeronautics, Missiles and Fire Control (MFC), Rotary and Mission Systems (RMS) and Space. Strong military aircraft and defense systems are in more demand today than ever. LMT is a leader in combat aircraft, missiles, military helicopters, and missile defense systems. In addition, their Space segment is a leader in satellite and defense missile systems. A growing part of the business is software and services to support their military products.
The F-35 fighter jet represents roughly 25% of LMT sales, and sales are expected to improve in the years ahead. The U.S. government’s current inventory objective is 2,456 aircraft for the military, and LMT has commitments from their eight international partners and overseas customers. The company is growing total revenue near 10%. LMT has gross margins at 16.2% and net profit margins of 13.8%. The company has a return on invested capital of 37.6%, a market capitalization of $110.3 billion and debt to asset ratio of 31.4%. We expect the business to hold up well in the event of a downturn in the economy or domestic government spending. LMT is trading near its 52 week high, and its valuation is pretty full. With earnings estimates for 2020 near $25.00 and revenue growth of 9.7%, the stock trades near a 22.2x P/E multiple and 23.9x Price/Cash Flow multiple. With a dividend of $9.60, the stock has a dividend yield of 2.46% and a payout ratio 44%. The company increased their dividend 10% in 2018.
- Medtronic (MDT)
We expect the healthcare sector to be challenging for investors next year in the face of an election. However, demographics still favor certain companies in healthcare, and we think Medtronic has a strong product pipeline. MDT is the largest medical device company, and after its merger with Covidien in 2015, has a diversified product offering and a global footprint. The company is a leader in pace makers and has new products in spinal cord stimulation and glucose regulation. Its new Micra pace maker is as small as a multivitamin and has significant growth potential if it is approved for dual-chamber heart application.
MDT has gross margins of 64% and operating margins near 23%. With debt/total assets of 28.2% the company has a conservative balance sheet. We expect the company’s revenue to increase from 2.0% over the past four years, to 4.4% over the next four years. MDT stock trades at a P/E of 26x when we exclude extraordinary items and Price/Cash Flow of 16.9x. The company raised its dividend by 8% last June to $0.54 per quarter. This provides a dividend yield of 1.94%, and we expect the company to earn roughly $6.05 per share next year. We believe this company is well positioned for an economic downturn and is one way to build defense into an equity portfolio.
- The Walt Disney Co. (DIS)
Disney is a diversified international family entertainment and media enterprise. It operates through five main business segments: Media Networks, Parks, Experiences and Products, Studio Entertainment and Direct-to-Consumer, and International (DTCI). The Media Networks segment, which includes cable and broadcast television networks, television production and distribution operations, domestic television stations, radio networks, and stations, has suffered with the decline in the use of cable. The Studio Entertainment segment produces and acquires live-action and animated motion pictures, direct-to-video content, musical recordings and live stage plays. This segment, which distributes films primarily under the Walt Disney Pictures, Marvel, Pixar, Touchstone and Lucas film names, has shown strong performance over the past several years, led by the Marvel and Star Wars franchises. Frozen 2 showed strong performance last week with $358 million box-office take globally.
The biggest news for the company is their move to Disney Plus, the new streaming service. This is a direct to consumer model that allows households to access Disney programming through a subscription service similar to Netflix. We expect this segment to add an incremental $100 million in revenue within two years.
Revenue growth is roughly running at 3%, with gross margins near 33.5% and profit margins near 20%. Debt/Total Assets is 24%. The stock trades at a 19.6x P/E ratio when adjusted for extraordinary items. We believe earnings have the potential to grow from $6.68 to $7.00 next year. DIS has a 32% payout ratio and pays a dividend of $0.88 per quarter, which translates to a dividend yield of 1.20%. While the dividend is on the low end of what we are looking for in a stock, the balance sheet and strong cash flow position the company well for stock repurchases.
- Alphabet, Inc. (GOOG)
Alphabet is a holding company, which engages in the business of acquisition and operation of different companies. It operates through the Google and Other Bets segments. The Google segment includes its main Internet products such as Ads, Android, Chrome, Commerce, Google Cloud, Google Maps, Google Play, Hardware, Search, and YouTube. The Other Bets segment, which is a significantly smaller part of the company, includes businesses such as Access, Calico, CapitalG, Nest, Verily, and Waymo.
Revenue growth is roughly running at 19%, with gross margins near 56.5% and profit margins near 25.5%. The company has virtually no debt with a Debt/Total Assets under 2%. The stock trades at a 23.9x P/E ratio when adjusted for extraordinary items. We believe earnings have the potential to grow from $47 to $55 next year. GOOG does not pay a dividend and has a return on invested capital over 18%. With a conservative balance sheet and strong cash flow, the company is well positioned to begin paying a dividend to shareholders and continue stock repurchases. The company has repurchased over $6.6 billion in stock over the first half of the year and has increased its current $12.5 billion stock repurchase program by an additional $25 billion.
Equities
For the short trading week, stocks continued their strong performance, with the DOW adding 1%, NASDAQ adding 2%, and S&P rising 1.2%. For November, the S&P climbed 3.4%, and year to date, gains are 25.3%. 7 of the 11 sectors are up more than 20%, and 2 are up in the high teens, so there is broad participation in this year’s rally. For the first time since 2013, all eleven sectors are on pace to be positive for the year. Technology is the leader, returning 42%. However, through last month, Health Care has been able to keep pace, matching Technology with 6% returns.
We continued to see the shift from physical stores to online as Friday saw an increase of 15% in online sales, up to $4.2 Billion. Retailers appear to be off to a decent start as we head into the holiday period, as we’ve had near record low unemployment and good wage growth. Amazon has been the largest player in the online space leading into Cyber Monday, but both Walmart and Target saw bigger jumps in online customer spending during the first 2 weeks of November compared with the same period last year. Walmart saw a 51% increase and Target saw a 47% increase, while Amazon customer spending grew 32%. The gap is starting to close between Amazon and competing retailers as they are investing in e-commerce options and winning back market share.
The largest percentage gainers from last week were Bed Bath and Beyond, Dick’s Sporting Goods, and Best Buy, returning 16%, 16%, and 11%. Dick’s Sporting Goods reported its strongest same store sales since 2013, with 6% growth vs the 2.9% expected. Sales were up 5% and e-commerce was up 13% as it beat on revenue and earnings and raised its profit outlook. They expect between $3.5-3.60 per share this year, up from $3.30. They are also expecting overall same store sales to increase 3%, compared with a 3% drop in 2018. The SPDR Retail ETF, ticker XRT, rose 3.5% last week in anticipation for this past weekend, and the ETF is up 9% YTD.
Fixed Income
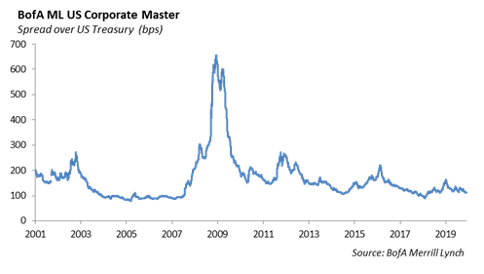
Rates did not move during a light trading and economic data holiday week. Corporate spreads did tighten during the quiet week as the need for secondary issues did not disappear with the lack of primary issuance. As spreads have tightened this year, the corporate curve has steepened roughly 20 bps. This is unsurprising news, as overall volatility has increased and low interest rates this year have caused investors to take a more defensive stance. With spreads relatively tight and liquidity quickly evaporating, we too have taken a defensive stance across our portfolios. We are still slightly short the duration of our benchmarks and have significantly decreased our exposure to spread duration by selling down credit 10 years and out. We will remain defensive until we see valuation in the credit markets improve.
High Yield
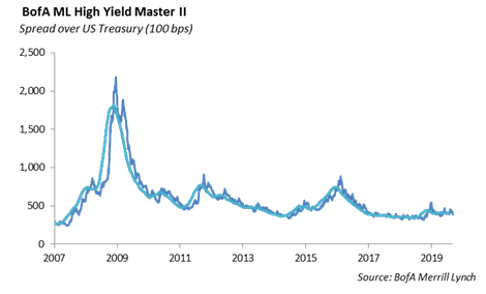
U.S. high yield had a good week to close out a strong November. The index saw 12 bps of tightening, with total return equal throughout the different quality tiers. All ratings returned just short of 0.5% in the shortened week. In regards to excess return, year-to-date high yield is outpacing the investment grade index with 6.8% versus 5.3%. BBs have led this charge, with over 8.5% excess return, while CCCs actually have negative excess return so far in 2019. High yield credit investors that have favored the up in quality trade have likely had the best year to date performance of any fixed income investors. 10-year plus IG investors have come just short of BBs, despite the longer duration and dramatic drop in the yield curve we have seen this year.
As expected, the primary market was slow last week. The lone notable issuer last week was mid-BB issuer, Melco Resorts. The company upsized their offering of 10yr senior notes to $900 million after seeing an oversubscription of 10x, due in part to the very low supply last week and month end positioning of portfolios, but still showing the strong demand investors have for yield while staying somewhat conservative in risk. Sometime before the end of the year, Cox Media is expected to issue over $1 billion of 8 year notes to finance the Apollo Global buyout.
In a typical year, when high yield is outperforming the fixed income asset class, the general rule would be the up in quality trade from CCCs and Bs into BBs; however, with higher quality junk credits tightening in spread and lower quality widening, investors are left with the difficult call to move up in quality sacrificing even more spread than they have already given up. For investors that have centered themselves in BBs, the up in quality trade to low IG looks attractive, as spread differences among BBs and BBBs are very low, but investors that have been involved in low quality credits, case by case analysis should be taken on company specific credit metrics. Most investors and publications do not anticipate a December like 2018, but investors should keep an eye on the busy slate of economic data coming out this week like nonfarm payrolls and ISM manufacturing data.
In our own strategies, we are moving up into BBB credits. For instance, we purchased Royal Bank of Scotland 2023’s at a 2.7% yield. We believe the marginally lower yield to BBs is well compensated by the higher quality protection.
In the energy markets, crude oil and natural gas both fell last week on the usual suspected of trade war escalation and oversupply. Eyes will be on the OPEC+ meeting this Friday, where expectations of deeper cuts have somewhat dampened.
Model Portfolios
Our income series models have performed quite strongly this year. While equities have been a great asset class this year, performance in our income models have also been driven by fixed income. Our US credit ETF is up 15% this year, outpacing many equity markets, including emerging markets. Given the tightening of credit spreads and stretched valuation, we are moving to a more defensive structure by shifting the allocation to a shorter duration credit ETF, ticker SPSB. This fund invests in short maturity corporates and has a duration of 1.75%, adding protection against both spread widening and increases in interest rates.
This report is published solely for informational purposes and is not to be construed as specific tax, legal or investment advice. Views should not be considered a recommendation to buy or sell nor should they be relied upon as investment advice. It does not constitute a personal recommendation or take into account the particular investment objectives, financial situations, or needs of individual investors. Information contained in this report is current as of the date of publication and has been obtained from third party sources believed to be reliable. WCM does not warrant or make any representation regarding the use or results of the information contained herein in terms of its correctness, accuracy, timeliness, reliability, or otherwise, and does not accept any responsibility for any loss or damage that results from its use. You should assume that Winthrop Capital Management has a financial interest in one or more of the positions discussed. Past performance is not a guide to future performance, future returns are not guaranteed, and a loss of original capital may occur. Winthrop Capital Management has no obligation to provide recipients hereof with updates or changes to such data.