Winthrop Capital Management Awarded Top Guns Designation by Informa Financial Intelligence
Indianapolis, IN – November 21, 2019— Winthrop Capital Management has been awarded a PSN Top Guns distinction by Informa Financial Intelligence’s PSN manager database, North America’s longest running database of investment managers.
Winthrop was honored with a 4 star Top Guns rating for its Large Cap Blend strategy, a 1 star rating for its Dividend Growth strategy, and a 1, 2, and 3 star rating for its Ultra-Short Fixed Income strategy.
PSN Top Guns ranks products in six proprietary categories in over 50 universes. This is a well-respected quarterly ranking and is widely used by institutional asset managers and investors. Informa Financial Intelligence is part of Informa plc, a leading provider of critical decision-making solutions and custom services to financial institutions.
Large Cap Blend
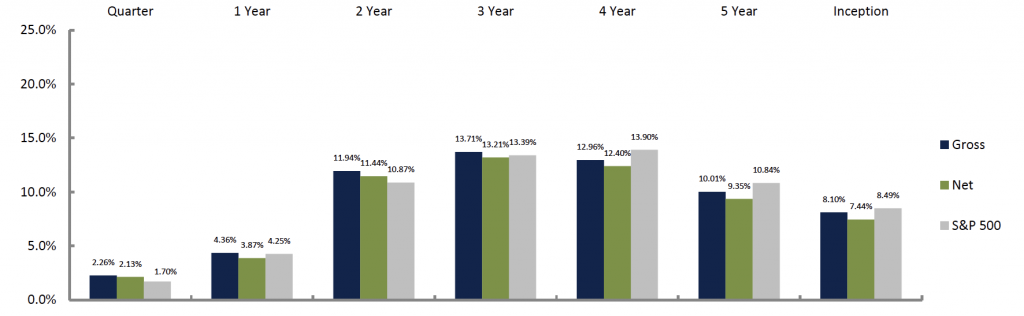
Our Large Cap Blend strategy returned 2.26% versus the S&P 500 Index return of 1.70% in the third quarter. In pursuing this strategy, WCM invests in medium and large public companies which are generating excess free cash flow and whose equity securities are trading at a discount to our estimation of intrinsic value.
- 4-Star Category – The Large Cap Blend strategy was awarded a Top Gun 4-Star Rating, meaning it had an r-squared of 0.80 or greater relative to the style benchmark for the recent five-year period. Moreover, returns must have exceeded the appropriate style benchmark for the three latest three-year rolling periods. The top ten returns for the latest three-year period then become the 4 Star Top Guns.
Dividend Growth
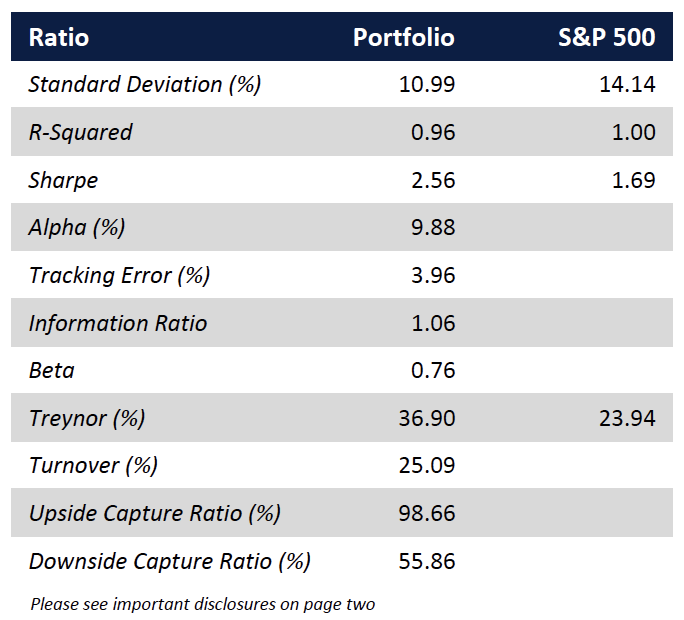
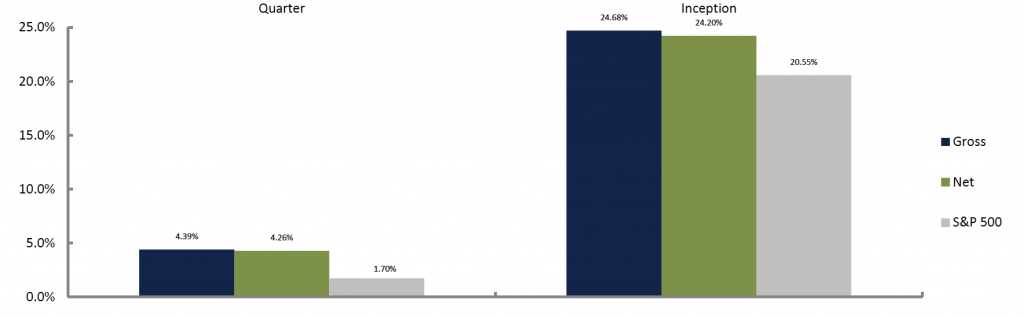
Our Dividend Growth strategy returned 4.39% versus the S&P 500 Index return of 1.70% in the third quarter. In pursuing this strategy, WCM seeks investment opportunities in large public companies that create shareholder returns through above average and sustainable dividend payments.
- 1-Star Category – The Dividend Growth strategy was awarded a Top Gun 1-Star rating, meaning it had one of the top ten returns for the quarter in its respective universe.
Ultra-Short Fixed Income
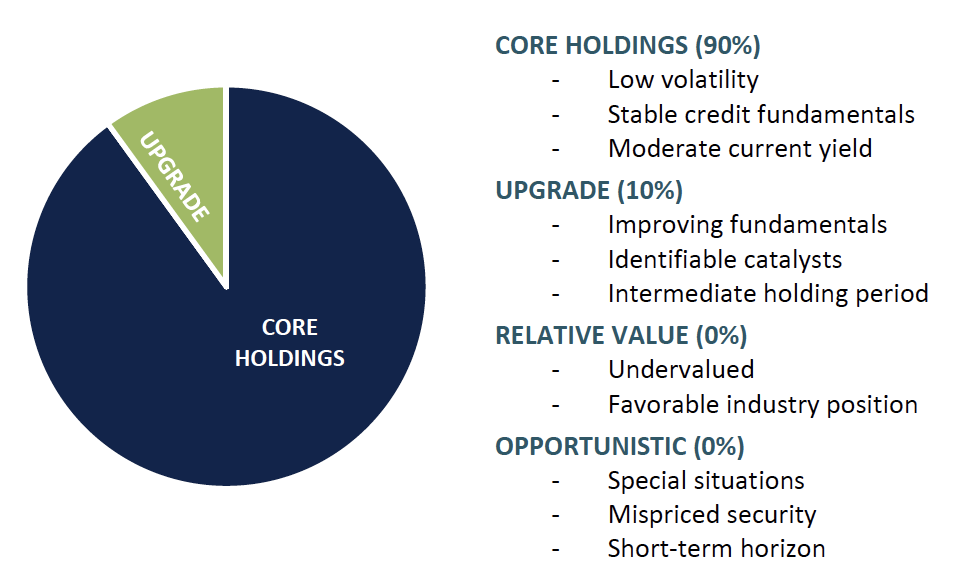
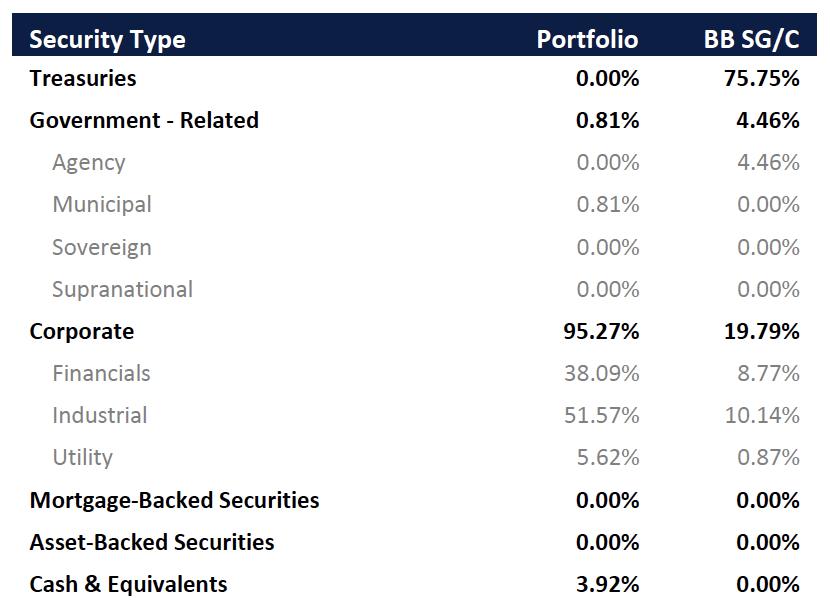
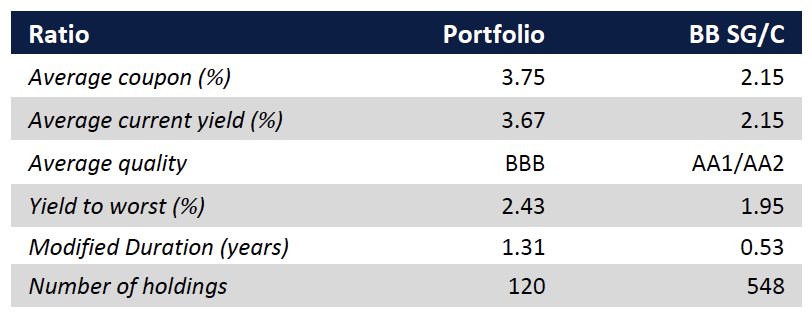
Our Ultra-Short strategy invests primarily in corporate and municipal bonds and has a duration of approximately 1.31 years and a weighted average yield-to-worst of 2.43%. In pursuing this strategy, WCM invests in investment grade corporate bonds, municipal bonds, asset-backed securities, mortgage-backed securities, and high yield bonds.
- 1-Star Category – Strategy had one of the top ten returns for the quarter in their respective universe.
- 2-Star Category – Strategy had one of the top ten returns for the one-year period in their respective universes.
- 3-Star Category – Strategy had one of the top ten returns for the three-year period in their respective universes
The complete list of PSN Top Guns and an overview of the methodology can be located on https://psn.fi.informais.com/.
About Winthrop Capital Management
Winthrop Capital Management is an SEC registered investment advisor with expertise in the management of fixed income and equity portfolios. WCM specializes in working with foundations, endowments, insurance companies, corporations, individuals and pension funds. We believe that a disciplined portfolio structuring process combined with strict relative value measurement and risk assessment, results in superior performance with a controlled level of risk. For more information about our investment philosophy and products, visit www.winthropcm.com.
About Informa Financial Intelligence’s Zephyr
Financial Intelligence, part of the Informa Intelligence Division of Informa plc, is a leading provider of products and services helping financial institutions around the world cut through the noise and take decisive action. Informa Financial Intelligence’s solutions provide unparalleled insight into market opportunity, competitive performance and customer segment behavioral patterns and performance through specialized industry research, intelligence, and insight. IFI’s Zephyr portfolio supports asset allocation, investment analysis, portfolio construction, and client communications that combine to help advisors and portfolio managers retain and grow client relationships. For more information about IFI, visit https://financialintelligence.informa.com. For more information about Zephyr’s PSN Separately Managed Accounts data, visit https://financialintelligence.informa.com/products-and-services/data-analysis-and-tools/psn-sma.
Large Cap Blend
Philosophy
Winthrop Capital Management (WCM) believes that a disciplined portfolio structuring process combined with strict relative value measurement results in superior performance and a controlled level of risk. Through our research process, we analyze each security and value every part of the organization’s capital structure. Through this process, we attempt to uncover investment opportunities overlooked by other investors. We consistently seek to build portfolios which are invested in securities that have been thoroughly researched, and to structure the portfolio in a manner to minimize risk and achieve the desired return objective.
Strategy
BENCHMARK: S&P 500 Index
The Large Cap Blend portfolio seeks investment opportunities in medium and large public companies which are generating excess free cash flow and whose equity securities are trading at a discount to our estimation of intrinsic value. Our relative value discipline allows us to measure risk and reward for each security within a company’s capital structure and invest where we see the best opportunity. Every security identified for investment must have a specific objective within the portfolio, and one or more clearly defined catalysts capable of producing an excess relative return over the ensuing 12-18 months.
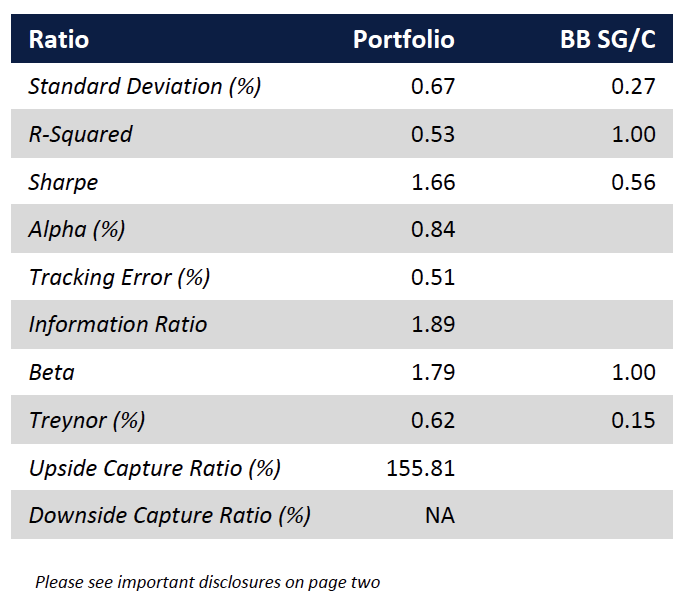
Performance Analytics
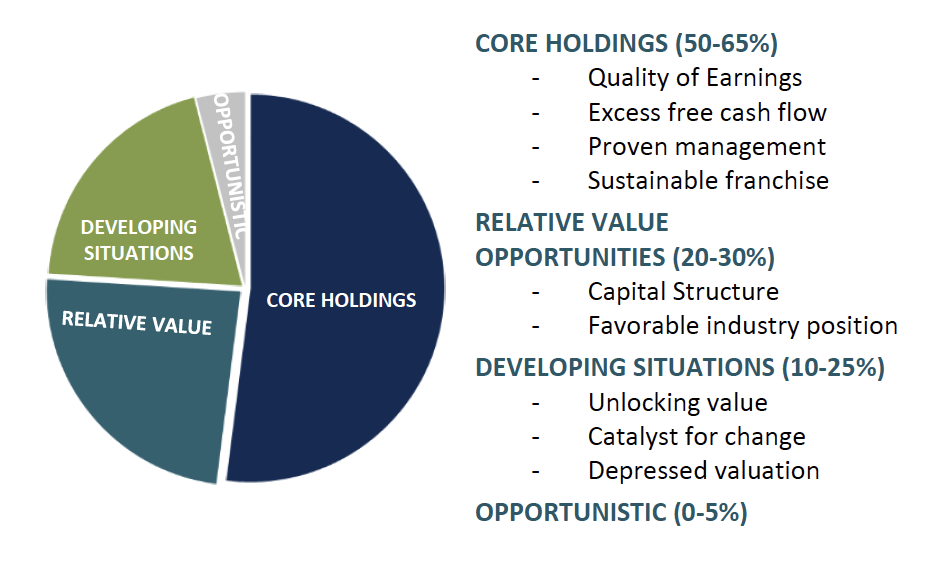
Portfolio Strategy
Annualized Total Return
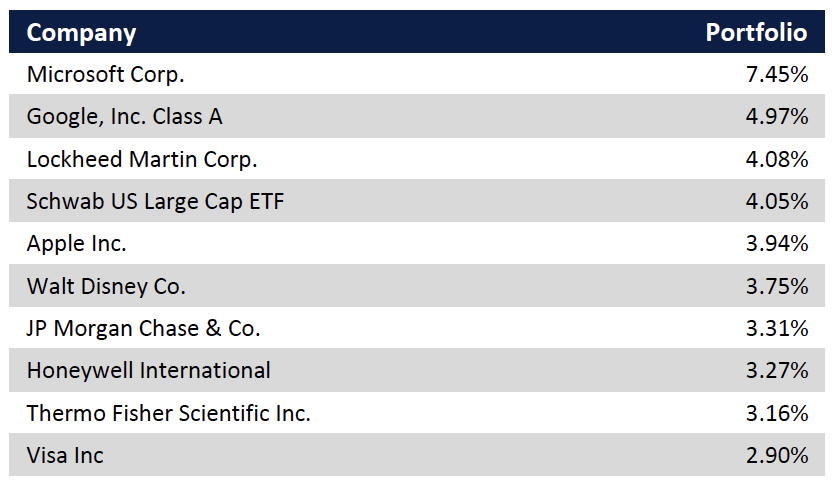
Top Ten Holdings
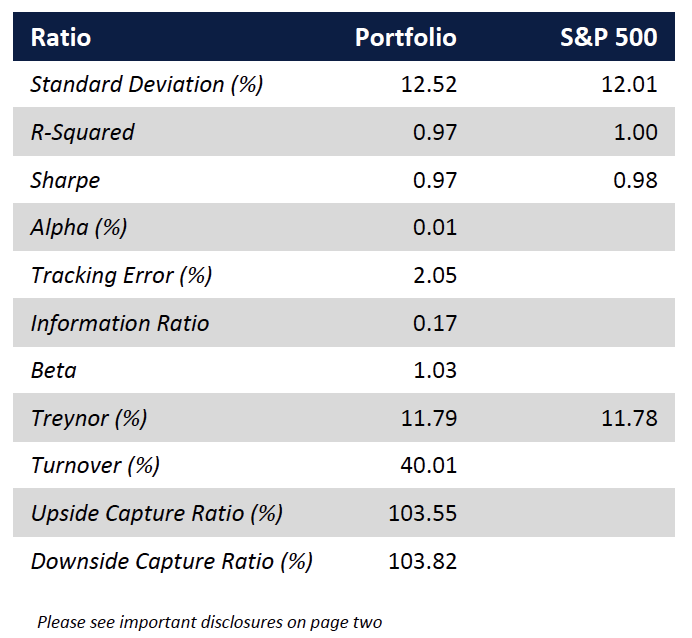
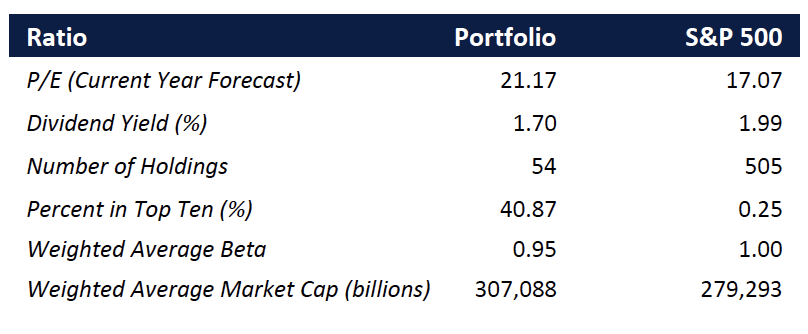
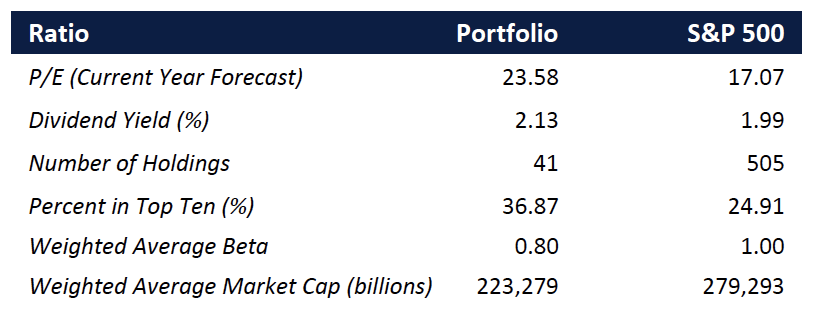
Portfolio Characteristics
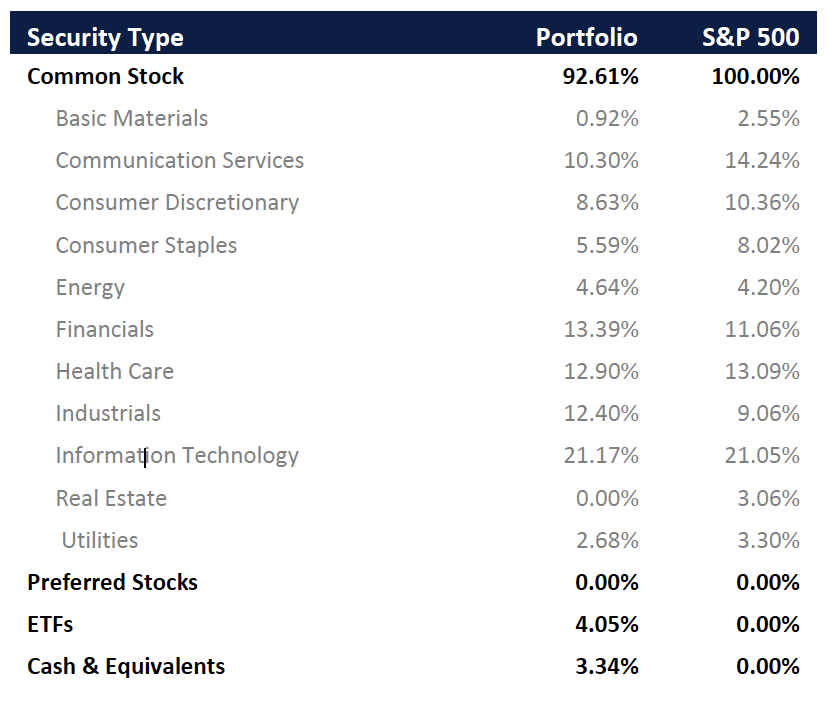
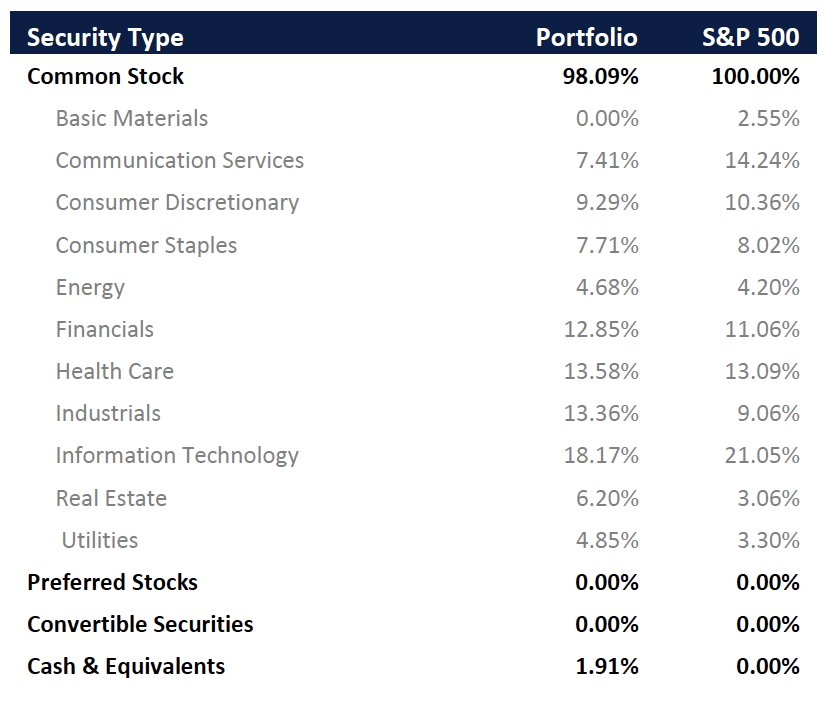
Sector Distribution
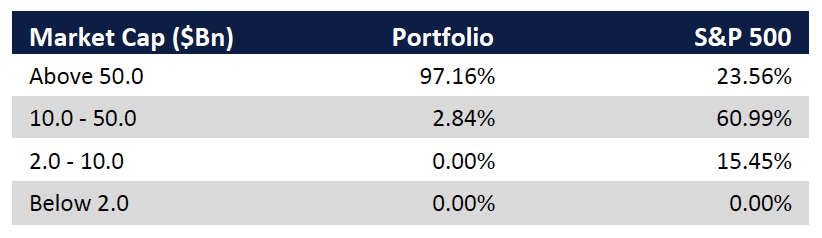
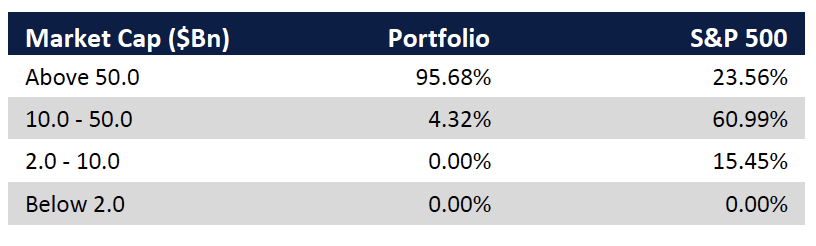
Market Cap Weights (% of Equities)
Disclosure
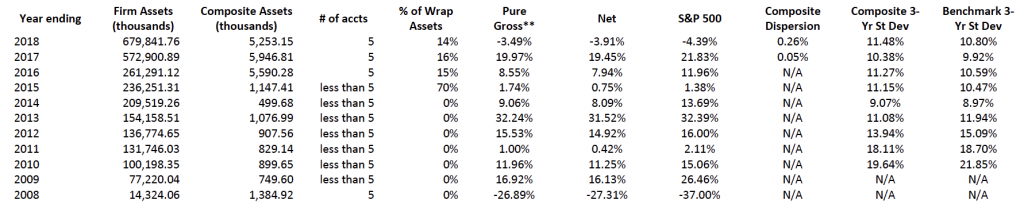
Inception Date: 12/31/2007
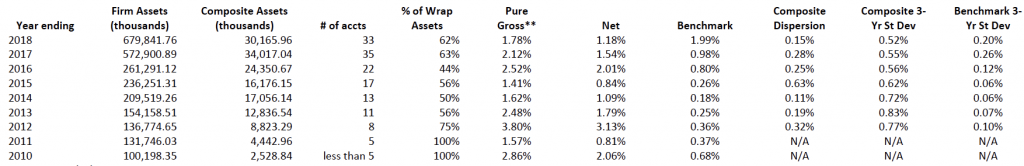
N/A (Composite Dispersion): Not meaningful due to fewer than five accounts in composite for entire year.
N/A (3Yr Standard Deviation): The 3 year annualized standard deviation is not presented because 36 monthly returns are not available.
**Pure Gross returns do not reflect the deduction of any expenses, including trading costs, for the wrap accounts in the composite and are supplemental to net returns.
Returns for the time period over one year are annualized.
Large Cap Blend Disclosure
The creation date for the composite is December 31, 2007. The Large Cap Blend Composite includes all portfolios that invest in primarily a large cap equity strategy. Investments will generally include common stocks of publicly traded companies. Preferred stocks may be used but generally do not comprise a major part of the portfolio. The majority of the portfolio will generally be invested in large cap and mid-cap public companies which are generating excess free cash flow and whose equity securities are trading at a discount to our estimation of intrinsic value. Small cap equities may be used but generally do not comprise a major part of the portfolio. The objective of the composite is to exceed the benchmark return. Winthrop Capital Management, LLC (WCM) claims compliance with the Global Investment Performance Standards (GIPS®) and has prepared and presented this report in compliance with the GIPS standards. WCM has been independently verified for the periods January 1, 2008 to December 31, 2018. The verification report(s) is/are available upon request. Verification assesses whether (1) the firm has complied with all the composite construction requirements of the GIPS standards on a firm-wide basis and (2) the firm’s policies and procedures are designed to calculate and present performance in compliance with the GIPS standards. Verification does not ensure the accuracy of any specific composite presentation. Winthrop Capital Management LLC (WCM) is a registered investment adviser with the United States Securities and Exchange Commission. Effective September 30, 2018, WCM became a wholly owned subsidiary of the Noyes Group, LLC. WCM continues to operate as an independent registered investment advisor. The firm’s list of composite descriptions is available upon request. Results are based on fully discretionary accounts under management, including those accounts no longer with the firm. All performance is expressed in U.S. dollars. Returns are presented gross and net of management fees and include the reinvestment of all income. Net of fee performance was calculated using actual management fees. In cases where management fees are paid out of an account other than the one in the composite, model fees are used based on the account’s prevailing fee schedule. Wrap fee accounts pay a fee based on a percentage of assets under management. Other than brokerage commissions this fee may include investment management, portfolio monitoring, consulting services, and in some cases, custodial services. Wrap fee schedules are provided by independent wrap sponsors and are available upon request from the respective wrap sponsor. Actual fees may vary depending on, among other things, the custodian, applicable fee schedule and portfolio size. Minimum asset level to be included in composite is $50,000. Additional information regarding the inclusion/exclusion of accounts is available upon request. The investment management fee schedule for the composite is 1.15% on the first $1 million, 1.00% on the next $2 million, 0.85% on the next $2 million, 0.75% on the next $10 million, and negotiable over $15 million. While WCM maintains a stated fee schedule, all fees are negotiable. Actual investment advisory fees incurred by clients may vary. The annual composite dispersion presented is an equal-weighted standard deviation calculated using gross returns of only those accounts that were in the composite for the entire year. Composite three-year standard deviation is calculated using gross returns. Additional information regarding the policies for valuing portfolios, calculating performance, and preparing compliant presentations is available upon request. Past performance may not be indicative of future results. Therefore, no current or prospective client should assume that the future performance of any specific investment or investment strategy will be profitable or equal to past performance levels. All investment strategies have the potential for profit or loss. Changes in investment strategies, contributions or withdrawals may materially alter the performance and results of your portfolio. Different types of investments involve varying degrees of risk, and there can be no assurance that any specific investment will either be suitable or profitable for a client’s portfolio. The percentage invested in a specific security and securities held in a portfolio managed in this style may vary between other similarly managed portfolios. There are no assurances that the investment objective of any portfolio will be achieved. The composite is measured against the Standard & Poor’s 500 Index (S&P 500). Historical performance results for investment indexes and/or categories generally do not reflect the deduction of transaction and/or custodial charges or the deduction of an investment-management fee, the incurrence of which would have the effect of decreasing historical performance results. Economic factors, market conditions, and investment strategies will affect the performance of any portfolio, and there are no assurances that it will match or outperform any particular benchmark. Investors should carefully consider a portfolio’s investment objective, risk, fees, charges and expenses before investing any money. To obtain this and other information, please call 317 663 7500 to request a WCM Firm Brochure and Supplement (Form ADV Part 2A & Part 2B). Please read the WCM Firm Brochure and Supplement carefully before investing your money.
NOT FDIC INSURED, NOT BANK INSURED, MAY LOSE VALUE, INCLUDING LOSS OF PRINCIPAL, AND IS NOT INSURED BY ANY STATE OR FEDERAL AGENCY.
*This data is provided as supplemental information. Top ten holdings are based on market value. The weighted average forward P/E is an estimate from Interactive Data and does not include preferred shares. Portfolio holdings are subject to change and are provided for informational purposes only and should not be deemed as a recommendation to buy or sell any security. Portfolio averages are calculated based on the actual security weights in the representative account. This information is based on a representative account within the Large Cap Blend Composite. The representative account has been selected with the following criteria: 1) The account is in the Large Cap Blend composite, 2) WCM represents that the holdings of the account are representative of the Large Cap Blend strategy.
Index Information
The Standard & Poor’s 500 Index (S&P 500) is a market value weighted index comprised of 500 of the largest publicly traded U.S. companies. The S&P 500 is an unmanaged, hypothetical portfolio of securities that is often used as a benchmark in evaluating the relative perfaormance of a particular investment. An index should only be compared with a mandate that has a similar investment objective. An index is not available for direct investment and does not reflect any of the costs associated with buying and selling individual securities or management fees. Standard and Poor’s and the S&P 500 are properties of The McGraw-Hill Companies.
Dividend Growth
Philosophy
Winthrop Capital Management (WCM) believes that a disciplined portfolio structuring process combined with strict relative value measurement results in superior performance and a controlled level of risk. Through our research process, we analyze each security and value every part of the organization’s capital structure. Through this process, we attempt to uncover investment opportunities overlooked by other investors. We consistently seek to build portfolios which are invested in securities that have been thoroughly researched, and to structure the portfolio in a manner to minimize risk and achieve the desired return objective.
Strategy
BENCHMARK: S&P 500
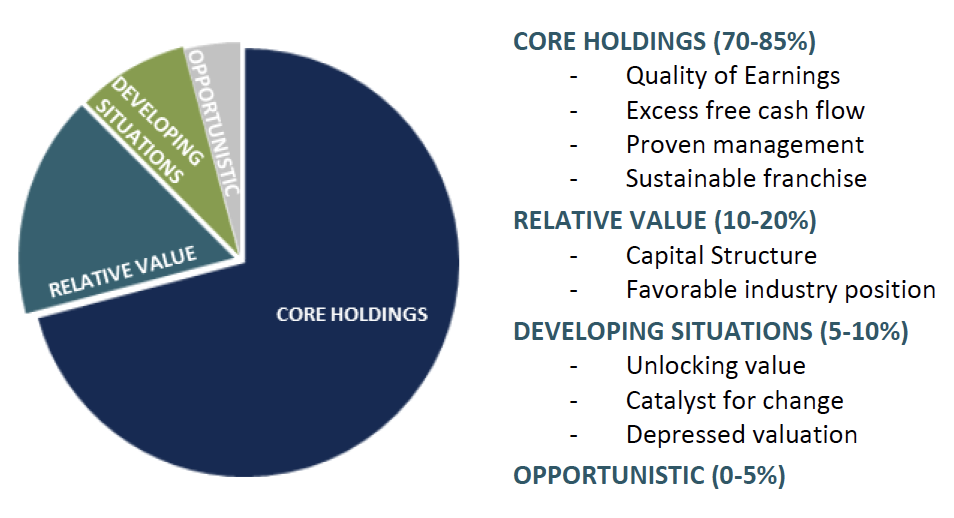
The Dividend Growth portfolio seeks investment opportunities in large public companies that create shareholder returns through above average and sustainable dividend payments. The portfolio generally consists of a higher allocation to cyclically defensive companies with very stable business models. Our relative value discipline allows us to measure risk and reward for each security within a company’s capital structure and invest where we see the best opportunity.
Performance Analytics
Portfolio Strategy
Annualized Total Return
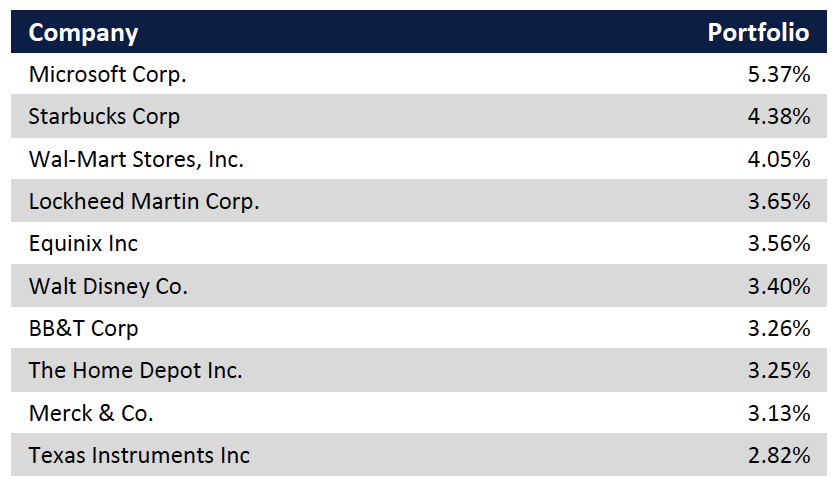
Top Ten Holdings
Portfolio Characteristics
Sector Distribution
Market Cap Weights (% of Equities)
Disclosure
Inception Date: 12/31/2018
Dividend Growth Disclosure
The creation date for the composite is December 31, 2018. The Dividend Growth Composite includes all portfolios that invest in primarily a dividend growth strategy. Investments will generally include common stocks of publicly traded companies. Preferred stocks may be used but generally do not comprise a major part of the portfolio. The majority of the portfolio will generally be invested in large cap and mid-cap public companies which are generating excess free cash flow and whose equity securities are trading at a discount to our estimation of intrinsic value. Small cap equities may be used but generally do not comprise a major part of the portfolio. The objective of the composite is to exceed the benchmark return. Winthrop Capital Management, LLC (WCM) claims compliance with the Global Investment Performance Standards (GIPS®) and has prepared and presented this report in compliance with the GIPS standards. WCM has been independently verified for the periods January 1, 2008 to December 31, 2018. The verification report(s) is/are available upon request. Verification assesses whether (1) the firm has complied with all the composite construction requirements of the GIPS standards on a firm-wide basis and (2) the firm’s policies and procedures are designed to calculate and present performance in compliance with the GIPS standards. Verification does not ensure the accuracy of any specific composite presentation. Winthrop Capital Management LLC (WCM) is a registered investment adviser with the United States Securities and Exchange Commission. Effective September 30, 2018, WCM became a wholly owned subsidiary of the Noyes Group, LLC. WCM continues to operate as an independent registered investment advisor. The firm’s list of composite descriptions is available upon request. Results are based on fully discretionary accounts under management, including those accounts no longer with the firm. All performance is expressed in U.S. dollars. Returns are presented gross and net of management fees and include the reinvestment of all income. Net of fee performance was calculated using actual management fees. In cases where management fees are paid out of an account other than the one in the composite, model fees are used based on the account’s prevailing fee schedule. Wrap fee accounts pay a fee based on a percentage of assets under management. Other than brokerage commissions this fee may include investment management, portfolio monitoring, consulting services, and in some cases, custodial services. Wrap fee schedules are provided by independent wrap sponsors and are available upon request from the respective wrap sponsor. Actual fees may vary depending on, among other things, the custodian, applicable fee schedule and portfolio size. Minimum asset level to be included in composite is $50,000. Additional information regarding the inclusion/exclusion of accounts is available upon request. The investment management fee schedule for the composite is 1.15% on the first $1 million, 1.00% on the next $2 million, 0.85% on the next $2 million, 0.75% on the next $10 million, and negotiable over $15 million. While WCM maintains a stated fee schedule, all fees are negotiable. Actual investment advisory fees incurred by clients may vary. The annual composite dispersion presented is an equal-weighted standard deviation calculated using gross returns of only those accounts that were in the composite for the entire year. Composite three-year standard deviation is calculated using gross returns. Additional information regarding the policies for valuing portfolios, calculating performance, and preparing compliant presentations is available upon request. Past performance may not be indicative of future results. Therefore, no current or prospective client should assume that the future performance of any specific investment or investment strategy will be profitable or equal to past performance levels. All investment strategies have the potential for profit or loss. Changes in investment strategies, contributions or withdrawals may materially alter the performance and results of your portfolio. Different types of investments involve varying degrees of risk, and there can be no assurance that any specific investment will either be suitable or profitable for a client’s portfolio. The percentage invested in a specific security and securities held in a portfolio managed in this style may vary between other similarly managed portfolios. There are no assurances that the investment objective of any portfolio will be achieved. The composite is measured against the Standard & Poor’s 500 Index (S&P 500). Historical performance results for investment indexes and/or categories generally do not reflect the deduction of transaction and/or custodial charges or the deduction of an investment-management fee, the incurrence of which would have the effect of decreasing historical performance results. Economic factors, market conditions, and investment strategies will affect the performance of any portfolio, and there are no assurances that it will match or outperform any particular benchmark. Investors should carefully consider a portfolio’s investment objective, risk, fees, charges and expenses before investing any money. To obtain this and other information, please call 317 663 7500 to request a WCM Firm Brochure and Supplement (Form ADV Part 2A & Part 2B). Please read the WCM Firm Brochure and Supplement carefully before investing your money.
NOT FDIC INSURED, NOT BANK INSURED, MAY LOSE VALUE, INCLUDING LOSS OF PRINCIPAL, AND IS NOT INSURED BY ANY STATE OR FEDERAL AGENCY.
*This data is provided as supplemental information. Top ten holdings are based on market value. The weighted average forward P/E is an estimate from Interactive Data and does not include preferred shares. Portfolio holdings are subject to change and are provided for informational purposes only and should not be deemed as a recommendation to buy or sell any security. Portfolio averages are calculated based on the actual security weights in the representative account. This information is based on a representative account within the Dividend Growth Composite. The representative account has been selected with the following criteria: 1) The account is in the Dividend Growth composite, 2) WCM represents that the holdings of the account are representative of the Dividend Growth strategy.
Index Information
The Standard & Poor’s 500 Index (S&P 500) is a market value weighted index comprised of 500 of the largest publicly traded U.S. companies. The S&P 500 is an unmanaged, hypothetical portfolio of securities that is often used as a benchmark in evaluating the relative performance of a particular investment. An index should only be compared with a mandate that has a similar investment objective. An index is not available for direct investment and does not reflect any of the costs associated with buying and selling individual securities or management fees. Standard and Poor’s and the S&P 500 are properties of The McGraw-Hill Companies.
Ultra-Short Fixed Income
Philosophy
Winthrop Capital Management (WCM) believes that a disciplined portfolio structuring process combined with strict relative value measurement results in superior performance and a controlled level of risk. Through our research process, we analyze each security and value every part of the organization’s capital structure. Through this process, we attempt to uncover investment opportunities overlooked by other investors. We consistently seek to build portfolios which are invested in securities that have been thoroughly researched, and to structure the portfolio in a manner to minimize risk and achieve the desired return objective.
Strategy
BENCHMARK: Bloomberg Barclays Short-term Government/Corporate Index
The Ultra-Short Fixed Income strategy offers a higher current yield alternative to short-term investments such as traditional money market funds. The strategy is designed to provide liquidity and principal preservation, but with more of an emphasis on seeking returns that are superior to traditional money market offerings. In pursuing this strategy, WCM invests in investment grade corporate bonds, municipal bonds, asset-backed securities, mortgage-backed securities, and high yield bonds. Individual security selection is based on our proprietary fundamental research.
Performance Analytics
Portfolio Strategy
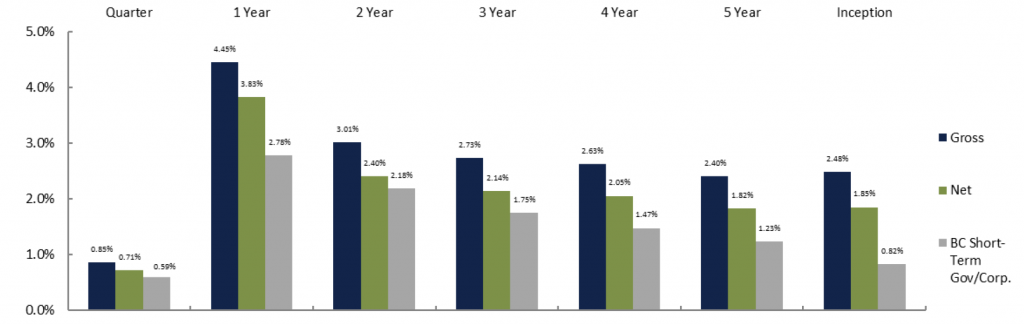
Annualized Total Return
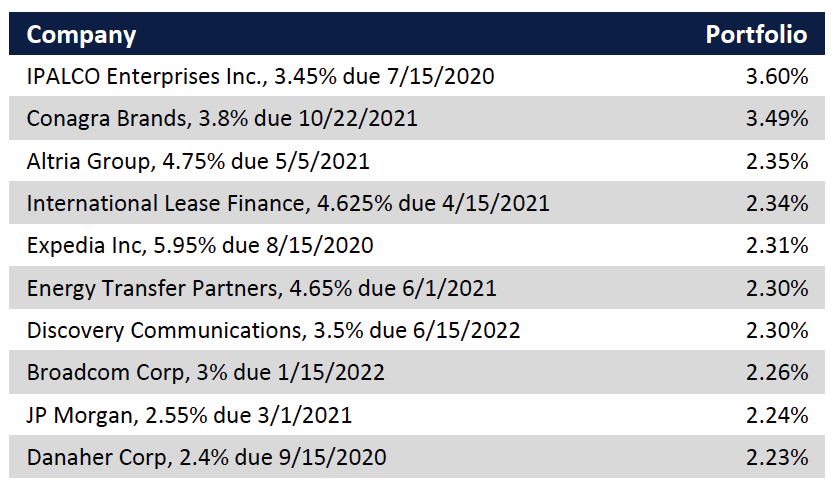
Top Ten Holdings
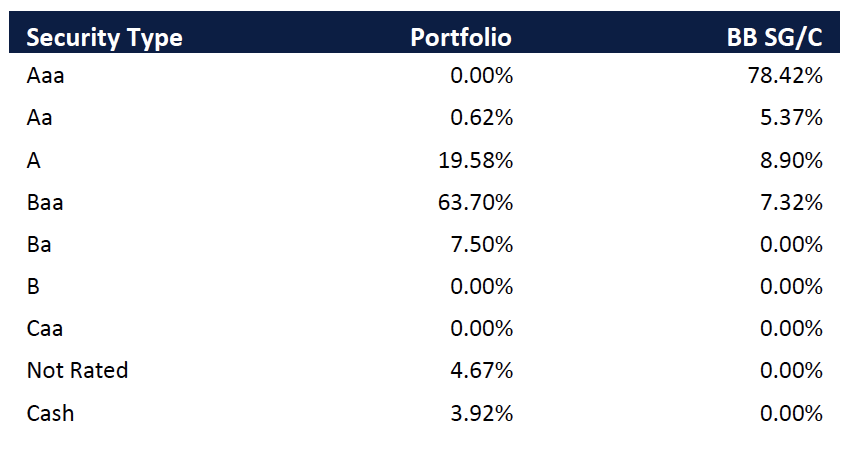
Quality Distribution
Sector Distribution
Portfolio Characteristics
Disclosure
Inception Date: 12/31/2009
N/A (Composite Dispersion): Not meaningful due to fewer than five accounts in composite for the entire year.
N/A (3 Year Standard Deviation): The 3 Year annualized standard deviation is not presented because 36 monthly returns are not available.
**Pure Gross returns do not reflect the deduction of any expenses, including trading costs, for the wrap accounts in the composite and are supplemental to net returns.
Returns for the time periods over one year are annualized.
Ultra-Short Fixed Income Disclosure
The creation date for the composite is December 31, 2009. The Ultra-Short Fixed Income Composite includes all portfolios that invest in a short duration fixed income strategy. Investments will generally include investment grade and high yield corporate bonds, and municipal bonds. U.S. treasuries and agencies, and structured securities may be used but generally do not comprise a major part of the portfolio. Securities generally will have a duration no longer than three years and portfolios have a targeted duration of 1 to 1.5 years. The objective of the strategy is to provide a return in excess of cash and other short-term money market funds. Winthrop Capital Management, LLC (WCM) claims compliance with the Global Investment Performance Standards (GIPS®) and has prepared and presented this report in compliance with the GIPS standards. WCM has been independently verified for the periods January 1, 2008 to December 31, 2018. The verification report(s) is/are available upon request. Verification assesses whether (1) the firm has complied with all the composite construction requirements of the GIPS standards on a firm-wide basis and (2) the firm’s policies and procedures are designed to calculate and present performance in compliance with the GIPS standards. Verification does not ensure the accuracy of any specific composite presentation. Winthrop Capital Management, LLC (WCM) is an investment advisor registered with the Securities and Exchange Commission. Effective September 30, 2018, WCM become a wholly owned subsidiary of the Noyes Group, LLC. WCM continues to operate as an independent registered investment advisor. The firm’s list of composite descriptions is available upon request. Results are based on fully discretionary accounts under management, including those accounts no longer with the firm. All performance is expressed in U.S. dollars. Returns are presented gross and net of management fees and include the reinvestment of all income. Net of fee performance was calculated using actual management fees. In cases where management fees are paid out of an account other than the one in the composite, model fees are used based on the account’s prevailing fee schedule. Wrap fee accounts pay a fee based on a percentage of assets under management. Other than brokerage commissions this fee may include investment management, portfolio monitoring, consulting services, and in some cases, custodial services. Wrap fee schedules are provided by independent wrap sponsors and are available upon request from the respective wrap sponsor. Actual fees may vary depending on, among other things, the custodian, applicable fee schedule and portfolio size. Minimum asset level to be included in composite is $200,000. Additional information regarding the inclusion/exclusion of account s is available upon request. The investment management fee schedule for the composite is 0.50% on the first $1 million, 0.45% on the next $2 million, 0.40% on the next $2 million, 0.35% on the next $5 million, and negotiable over $10 million. While WCM maintains a stated fee schedule, all fees are negotiable. Actual investment advisory fees incurred by clients may vary. The annual composite dispersion presented is an equal-weighted standard deviation calculated using gross returns of only those accounts that were in the composite for the entire year. Composite three-year standard deviation is calculated using gross returns. Additional information regarding the policies for valuing portfolios, calculating performance, and preparing compliant presentations is available upon request. Past performance may not be indicative of future results. Therefore, no current or prospective client should assume that the future performance of any specific investment or investment strategy will be profitable or equal to past performance levels. All investment strategies have the potential for profit or loss. Changes in investment strategies, contributions or withdrawals may materially alter the performance and results of your portfolio. Different types of investments involve varying degrees of risk, and there can be no assurance that any specific investment will either be suitable or profitable for a client’s portfolio. The percentage invested in a specific security and securities held in a portfolio managed in this style may vary between other similarly managed portfolios. There are no assurances that the investment objective of any portfolio will be achieved. The composite is measured against the Bloomberg Barclays Short-term Government/Corporate Index. Historical performance results for investment indexes and/or categories generally do not reflect the deduction of transaction and/or custodial charges or the deduction of an investment-management fee, the incurrence of which would have the effect of decreasing historical performance results. Economic factors, market conditions, and investment strategies will affect the performance of any portfolio, and there are no assurances that it will match or outperform any particular benchmark. Investors should carefully consider a portfolio’s investment objective, risk, fees, charges and expenses before investing any money. To obtain this and other information, please call 317 663 7500 to request a WCM Firm Brochure and Supplement (Form ADV Part 2A & Part 2B). Please read the WCM Firm Brochure and Supplement carefully before investing your money.
NOT FDIC INSURED, NOT BANK INSURED, MAY LOSE VALUE, INCLUDING LOSS OF PRINCIPAL, AND IS NOT INSURED BY ANY STATE OR FEDERAL AGENCY.
*This data is provided as supplemental information. Top ten holdings are based on market value. Portfolio holdings are subject to change and are provided for informational purposes only and should not be deemed as a recommendation to buy or sell any security. Average Quality excludes ETFs and common stocks. Portfolio averages are calculated based on the actual security weights in the representative account. This information is based on a representative account within the Ultra-Short Fixed Income composite. The representative account has been selected with the following criteria: 1) The account is in the Ultra-Short Fixed Income composite, 2) WCM represents that the holdings of the account are representative of the Ultra-Short Fixed Income strategy.
Index Information
The Barclays Short-term Government/Corporate Index (BB Short Gov/Corp) returns are provided to represent the investment environment existing during the time periods shown. The BB Short-term Government/Corporate Index includes government and corporate securities that have a remaining maturity from 1 up to (but not including) 12 months. For comparison purposes, each index is fully invested, which includes the reinvestment of income. The returns for the index do not include any transaction costs, management fees or other costs. An index should only be compared with a mandate that has a similar investment objective. An index is not available for direct investment.