Navigating the Coronavirus
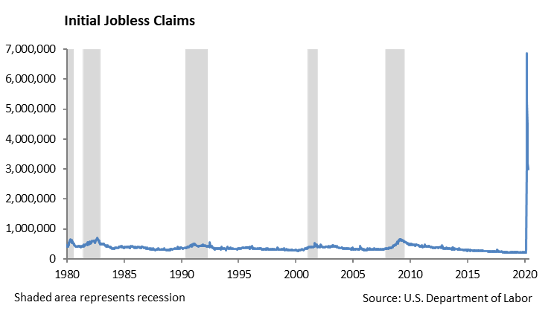
The impact of the efforts to control the spread of the coronavirus on the economy have been nothing short of horrific. Global economic growth is expected to contract by over 3% this year. Central banks of developed countries are putting massive monetary support behind their economies in an effort to prop up their financial system and keep their economy functioning. Domestic economic growth fell by -4.8% annually in the first quarter. Three million more people filed for unemployment benefits last week, bringing the total to 36.5 million since the COVID-19 pandemic ignited.
We expect the impact of the pandemic to move through the economy in two stages:
- The initial stage, which we are currently moving through, is navigating the impact that the abrupt shutdown of the economy has had on business operations.
- This stage is described by the survival of the company. This includes insuring that companies have rightsized expenses in the face of deteriorating revenue and that liquidity is sufficient to support operations through an uncertain near term future.
- This stage has the most severe impact on business models that were stressed heading into the pandemic or no longer efficient. These models include the airline and retail industries, as well as higher education. In addition, restaurants and some service industries would be included as well.
- The second stage is managing through the competitive and economic uncertainty. This stage will be characterized by adopting the company to a new competitive environment with potentially impaired financial statements. We believe we will transition to the second stage be the end of 2Q 2020 and this will likely last through the remainder of the year.
- This stage will be characterized by slow revenue growth and cost containment. Identifying companies that are not able to compete over the long term will be important to avoiding credit problems in the portfolio. Companies with disrupted supply chains will need to rebuild their supply network. Industries impacted in the second stage would include real estate, airline, travel, retail, energy, manufacturing and chemicals.
- This second stage will impact how people gather together which will include business travel, tourism, professional and recreational sporting events, concerts, and fairs. In addition, this will effect education including the fall high school and college semester, as well as college and high school sports. Small colleges and universities that rely on tuition and have small or encumbered endowments will likely close. As a result, municipal bonds including small universities, arena financing and convention center bonds that derive debt service payments from revenues of the facilities will be impacted.
The Impact on Business
This past week Fed Chairman Powell spoke and provided sobering assessment of the economy and near term difficulties we face. Even if we have a way to better control the spread of the virus, this will be a long road to economic recovery. We are in unchartered waters without a map. There are several reasons for this assessment:
- Restaurants and food service businesses that are able to reopen for business, but are limited by capacity will likely not be profitable.
- A portion of employees that were furloughed during the initial phase of the pandemic will likely be laid off leading to a higher level of sustained unemployment.
- Companies have learned how to work efficiently with employees working remotely. This will reduce the office space footprint, increase vacancy rates, and put pressure on commercial real estate.
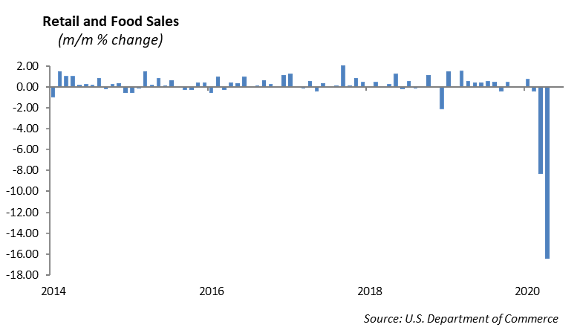
- Retail sales were reported lower by -16.4% in April last week by the Commerce Department. Retail sales will be slow to rebound as brick-and-mortar stores require safety masks and distancing leading to a dismal in store shopping experience.
- Students considering college will be challenged to rationalize the tuition costs under the current model with the “new” classroom experience combined with on-line education. The potential decline in enrollment will impact ancillary business that support the college and its students.
- Business travel will be slow to pick up as TSA starts taking temperatures of travelers, airlines reconfigure a seating chart that provides safe distancing between passengers, and hotels provide incentives for business travelers to return.
- The crucial summer tourism period will be under the cloud of the virus due to safety concerns and uncertain job security.
- Funding gaps in certain states will reveal deterioration in their fiscal position including unfunded pension liabilities. Illinois and New Jersey appear particularly vulnerable.
We do expect to see a rebound in the economy in the second half of the year, however it will be slow. There will come a point where consumption will pick up and whatever experienced was lost to the pandemic, such as a graduation, a wedding, or an anniversary will be celebrated. In addition, the stimulus in the system will have an extraordinary impact on business activity. We expect that the Fed will continue to push interest rates lower and flirt with negative interest rates.
We still do not know what a return to normal looks like.
Equity
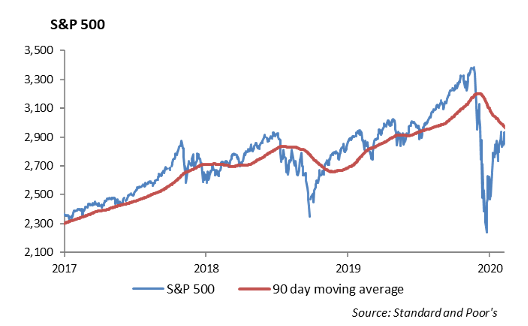
The S&P 500 Index was down -2.26% last week ending at 2863. The index is down -11.36% year-to-date and -15% off of all-time highs. The best performing sectors this year are Information Technology and Health Care, returning 1.83% and -1.73% respectively. The worst performing sectors are Energy, Financials, and Industrials, returning -27%, -32%, and -40% respectively.
Earnings season is beginning to wind down, with 86% of companies in the S&P 500 reporting results. 66% of companies have reported an earnings beat, and 58% of the companies have reported a revenue beat.
For the upcoming week, the earnings calendar is as follows:
- Tuesday: Home Depot (HD), Kohl’s (KSS), TJX Companies (TJX), Walmart (WMT)
- Wednesday: Lowe’s (LOW), Target (TGT)
- Thursday: Medtronic (MDT), Intuit (INTU), Nordstrom (JWN), NVIDIA Corporation (NVDA)
- Friday: VF Corp (VFC)
Consumer Discretionary will be the focus this week. So far, 60% of companies within the sector have beat earnings estimates, and 70% of companies have beat sales estimates. Retail sales for April showed a -16% decline month to month and year over year. Laggards for the month were electronics, clothing stores, and furniture/home furnishing. Electronics was down -61% month over month and -65% year over year. Clothing stores were down -79% month over month and -89% year over year. Furniture/home furnishing was down -58% month over month and -67% year over year. However, a few subsectors show signs of strength. Non-store retailers such as Amazon.com Inc (AMZN), Wayfair Inc (W), and Etsy Inc (ETSY) had an overall increase of 8.4% in month over month sales.
Grocery store sales fell -13% month over month from April to March, but sales are still up 13% year-over-year. Kroger Co (KR) showed strength in its earnings last quarter, and other contributors include Walmart Inc (WMT), Target Corporation (TGT), and Costco Wholesale Corporation (COST). Finally, Building Materials and Garden Equipment sales held up, rising 0.4% year over year.
Overall, the consumer discretionary sector is down -8% year-to-date, and it is outperforming the S&P by 4%. With lower traffic and a weak consumer, it would seem that the sector should not be outperforming the index. However, its top seven holdings represent over 60% of the sector and are positive contributors to performance:
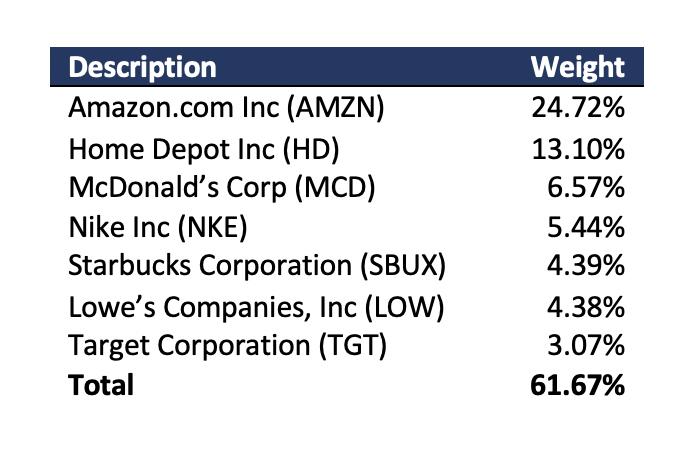
As a cap-weighted group, Amazon, Home Depot, McDonald’s, and Nike are up 16% year to date. The rest of the sector is down -22%, which is a 38% difference in performance. We are underweight Consumer Discretionary as the retail sector struggles and consumption is lower. J. C. Penny, Neiman Marcus and J. Crew have all filed for bankruptcy protection.
Model Portfolios
Volatility has increased in the capital markets and we continue to shift to a defense position in Model Portfolios. The financial, utilities and real estate sectors have moved into correction territory for the year, marked by a decline of -10% from their recent highs. In addition, small cap, measured by the Russell 2000, is close to correction, down -9.1% from its recent high.
In our Model Portfolios, we are reducing exposure in our international sleeves in both developed and emerging markets. There are currently no clear catalysts for growth in these sectors. We are focusing more exposure to the domestic large cap market and building defense by adding to USMV, the minimum volatility ETF, and SCHD, the large cap dividend ETF. Both are underperforming the index year-to-date. SCHD offers more exposure to defensive sectors, as well as a dividend yield of 3.7% versus the index yield of just over 2%.
Fixed Income
Despite the expectation of an incoming wave of U.S. Treasury issuance, the flight to quality assets resumed this week. The 10-year U.S. Treasury fell -6bps over the week, back down to 0.64%. Assets were clearly flowing into the U.S. as rates globally were mostly unchanged. Regardless, negative yielding debt across the globe still remains large at $12 trillion. We continue to believe rates will go lower as both growth and inflation are rapidly slowing despite central bank policies.
Corporate credit markets were dominated by new issuance of over $50 billion last week, which led to a widening of spreads in secondary markets. Concessions are averaging 10bps, but the sheer volume of bonds coming to market has led to very little post issuance performance. Issuance is expected to slow ahead of Memorial Day weekend, and we believe a slowing trend will continue into the summer.
Despite significant volatility in March and April, corporate credit is outperforming the S&P 500 by over 10% year-to-date. Within fixed income, there is a large investable universe where many have outperformed corporates, and others have severely underperformed. Despite falling inflation estimates, Treasury Inflation Protection ETF’s (TIP) have held against credit risk, up nearly 5% year-to-date. We believe TIPs will be challenged in the near term as deflation becomes increasingly probable.
Conversely, bank loans have underperformed. The Invesco Senior Loan ETF (BKLN) is down -7.50% in 2020 as non-investment grade fixed income has a large concentration in the energy, retail, and airline sectors. Emerging market debt has also struggled this year, as a strengthening dollar has made it increasingly costly to emerging economies that generally issue debt in dollars. In our Model Portfolios, we continue to focus on corporate credit as spreads are currently 100bps wider than a year ago. In addition, we believe the Fed’s intention to purchase corporate bonds in their purchase programs will eventually lead to tighter spreads as the primary issue market slows through the summer.
High Yield
High yield spreads widened significantly last week, despite a tightening in investment grade bonds. The U.S. High Yield Corporate Bond Index widened 26 bps, primarily due to BB and B rated security performance. Higher-rated securities also underperformed CCCs in total return. All rating tiers had negative performance.
The primary market saw $12 billion in new issuance. The Gaming and Media industries were prominent in issuing debt, as Boyd Gaming, Penn National, Lamar Media, and Outfront Media all addressed liquidity support. Bausch Health, a frequent private placement issuer, also tapped the market to redeem 2022 maturities. The high yield market continues to see new issuance for liquidity reasons, with better positioned companies taking advantage of lower yields to refinance debt. Concessions on high yield new issuance have largely disappeared in the last two weeks, with many deals pricing to perfection of current curves. Thus, performance on these issues vary on name by name basis, it appears that the time of high yield issuance immediately trading up multiple points is over.
Despite the negative performance in high yield bonds and the tightening of treasuries, U.S. high yield funds continued to have strong inflows for their seventh straight week. Last week, investors bought $4.5 billion in high yield ETFs and mutual funds. Retail investors continue to go to high yield funds to reach for those inflated yields.
Retail corporations have been an area of focus in the current environment. Sales continued to fall in April, down -16% month over month. Macy’s and Nordstrom have been under immense pressure to support liquidity for survival until the public returns to in-store shopping. Macy’s 2024 dated debt is trading at 65 cents on the dollar and their 2043 dated debt is trading at 55 cents on the dollar. Estimates suggest that Macy’s can operate for about 6 more months without raising additional liquidity. The company is allegedly planning on coming to market with a $2 billion real estate secured offering that may or may not include their famous Herald Square property. Other retailers have already issued secured debt, including Nordstrom, Gap, and Kohl’s. We believe that retail property values will be under pressure, and we would caution investors against retail debt and equity.
This report is published solely for informational purposes and is not to be construed as specific tax, legal or investment advice. Views should not be considered a recommendation to buy or sell nor should they be relied upon as investment advice. It does not constitute a personal recommendation or take into account the particular investment objectives, financial situations, or needs of individual investors. Information contained in this report is current as of the date of publication and has been obtained from third party sources believed to be reliable. WCM does not warrant or make any representation regarding the use or results of the information contained herein in terms of its correctness, accuracy, timeliness, reliability, or otherwise, and does not accept any responsibility for any loss or damage that results from its use. You should assume that Winthrop Capital Management has a financial interest in one or more of the positions discussed. Past performance is not a guide to future performance, future returns are not guaranteed, and a loss of original capital may occur. Winthrop Capital Management has no obligation to provide recipients hereof with updates or changes to such data.