Economy
The global economy is slowing as a result of the coronavirus spreading from China. China is the epicenter and has taken steps to contain the spread of the virus at the expense of economic growth. Cities such as Wuhan and Chengdu have effectively been shut down as schools and businesses remain closed and people are left to stay home. Schools have been closed since early February and are not expected to open until March. The manufacturing industry in China is running at a fraction of its capacity. To reopen a business requires approval from the municipal health officials and the travel history of every employee requires verification. It will be a major effort to restart China’s behemoth manufacturing sector.
The Commerce Department reported that domestic manufacturing slipped in January as industrial production decreased a seasonally adjusted 0.3% from the prior month. The production halt of the 737 MAX combined with the coronavirus have had a negative impact on manufacturing.
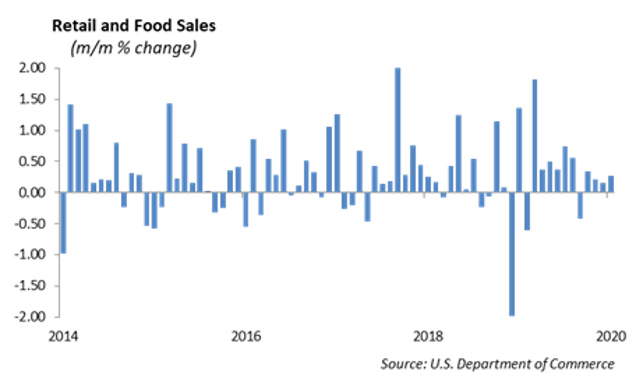
However, consumer spending, measured by retail sales, increased in January by 0.3% after a mediocre holiday shopping season. The U.S. consumer remains optimistic and is the main driver for domestic economic growth.
We believe that we are seeing the best that the domestic economy can produce right now given the headwinds of a pullback in manufacturing and the impact of the spreading coronavirus. The risk to the economy are to the downside given the increased number of lay-offs and the rather weak showing in an overall positive January consumer spending report. We are concerned that the overly strong labor report in January does not correlate with the increased number of lay-offs that are happening across businesses. At the same time, the domestic economic figures we are seeing do not yet reflect the impact of the 737 MAX shut down at Boeing and downstream supply chain companies.
From a macro standpoint, we continue to reduce risk in portfolios by shifting away from domestic large cap equity and underweight international equity. In fixed income portfolios, long U.S. Treasuries will likely benefit from further slowing economic growth.
Monetary Policy
We are seeing the largest monetary stimulus from the Fed since the Financial Crisis – or maybe we are missing it. Since the imbalances in the repo market in mid-September last year, the Fed has been buying U.S. Treasuries back onto its balance sheet at the largest pace since 2009. This quiet initiative has resulted in over 20% increase in Reserve Bank Credit reported on the Fed’s balance sheet. This amounts to a huge stimulus to the capital markets and provides support for current valuations of financial assets. We expect the Fed will put a permanent repo facility in place sometime this year.
Equities
The S&P was up 1.58% last week to bring year to date gains to 4.62%. We are currently at all-time highs.
We are over halfway through 4th quarter earnings and estimates seem to have improved from the projected 0.30% decline. Growth is estimated to be 2.3% with 71% of S&P companies reporting above estimates. Growth has been driven by communication services and technology.
Under Armor (UAA) Earnings
Although revenue was up 3.6% Y/Y at $1.44 billion, it still missed by $30 million. Earnings of 10 cents were in line with forecasts. Revenue was up 1.9% to $983 million in North America, and up 9.8% in Asia-Pacific to $183 million. For full year revenue guidance, they are projecting a decline in low single digits, with a $50-60 million hit in sales from the coronavirus. Earnings are projected around 10-13 cents vs. the 46 cent consensus for 2020. They are experiencing demand challenges as well per their CEO. But weak guidance led to a huge decline and the stock was down over 15% to under $17 right at their 52 week low.
Income Series
Our income series model invests in equities and fixed income ETFs that provide us a dividend yield that is well above what you can receive from simply investing in the index. The dividend yield is around 4% for all of our strategies within the model, vs. the 1.75% yield of the S&P. This model has sleeves of Investment Grade, Municipals, Large Cap, Mid Cap, Small Cap, Developed, and Emerging market ETFs, with an average expense ratio of 9 bps.
Fixed Income
Interest rates were little changed through the week as US data remained resilient despite continued global concerns of a spreading coronavirus. The 10-year treasury ended the week at 1.58%. The treasury curve, however, did continue to flatten and is inverted based off of the 3 month treasury.
Spreads remain tight as credit index remain below 100 OAS. With rates low and volatility low, primary markets have been very active over the past 2 weeks. New issues have been very well received with deals running 5-10x oversubscribed.
Investors in search of yield could be tempted to step into unfamiliar territory such as the levered loan/CLO market. These are bank loans to lower rated and generally smaller companies than those in the public market. The size of the levered loan market has doubled over the past decade, and at $1.2 trillion in size it is now larger than the US high yield market. Currently the levered loan index has a yield of 5.57%.
While many will cite the fact that levered loans and CLO’s held up well over the stress of the financial crisis, we would argue that the asset class has changed significantly since that time. Coming out in 2010, less than 20% of the index’s loans had covenant lite loans. According to S&P, over 80% of loans in the index are now covenant lite. This means that current loans do not have to upkeep their covenants past initial issuance, which could lead to more problems in a credit downturn. Investors should also be aware of the fact that levered loans are generally float rate; therefore, as rates trend lower, the yield you thought you purchased could become reset at a much lower rate. We prefer the BB part of the high yield market over levered loans. Fixed rates, increased liquidity, and more transparency into the credits we are investing gives us more comfort with our projected return.
High Yield
Closed end high yield funds or high yield bond ETFs are options for wealth management clients that may benefit from added income, yet do not have the capacity to own individual high yield bonds.
High Yield Bond ETFs
The most common high yield ETFs are tickers JNK and HYG. These ETFs offer a cheaper way for investors to add income to their portfolios. The SPDR Bloomberg Barclays High Yield Bond ETF, ticker JNK, tracks the High Yield Very Liquid Index. This ETF has a 12-month yield of 5.46% and carries an expense ratio of 40 bps. The iShares iBoxx $ High Yield Corporate Bond ETF, ticker HYG, offers a similar product, being indexed to a different liquid high yield index. HYG had a 12-month yield of 5.02% while having an expense ratio of 49 bps. These funds carry the risk of being high yield indexing funds and will have broad exposure across all the high yield qualities, from the relatively safer BBs to the high risk CCCs tranche.
Closed End High Yield Funds
Closed end high yield funds such as the BlackRock Corporate High Yield Fund, ticker HYT, adds income far greater than the ETFs, but introduce additional leveraging risk and are more expensive. HYT had a 12-month yield of 7.69% while carrying a 154 bps expense ratio and is almost 30% leveraged. The Western Asset High Income Fund, ticker HIX, is another closed end fund. It’s 12-month yield is 8.07%, with the most expensive expense ratio of 2%. This fund is slightly less levered than HYT at 27%. Use of leverage in closed end funds introduces more volatility than in ETFs. Investors may also realize less liquidity in adding to or trimming their position than high yield ETFs. In closed end funds, investors may receive the advantage of having an actively managed portfolio actively manage, and managers can pick and choose their spots, unlike passive ETFs which track their underlying index.
For open and closed end investment grade credit funds, the same basic rules apply: closed end funds offer a boosted yield, but at a great expense and higher volatility due to leveraging. The iShares Core U.S. Aggregate Bond ETF, ticker AGG, offers a 12-month distribution yield of 2.63% while carrying a very low expense ratio of 5 bps. The BlackRock Core Bond Trust, ticker BHK, has a 12-month yield of 5.09% with an expense ratio of 1.16% and a leverage amount just south of 30%. This closed end fund provides yield similar to high yield ETFs, but replaces volatility from underlying credit risk to leveraging risk.
Since closed end funds are issued similarly to an IPO, and no new shares are ever created, these funds often trade to premium or discount of their underlying assets. In turn, this adds more risk and also can provide clear attractive or unattractive entry points to investment.
This report is published solely for informational purposes and is not to be construed as specific tax, legal or investment advice. Views should not be considered a recommendation to buy or sell nor should they be relied upon as investment advice. It does not constitute a personal recommendation or take into account the particular investment objectives, financial situations, or needs of individual investors. Information contained in this report is current as of the date of publication and has been obtained from third party sources believed to be reliable. WCM does not warrant or make any representation regarding the use or results of the information contained herein in terms of its correctness, accuracy, timeliness, reliability, or otherwise, and does not accept any responsibility for any loss or damage that results from its use. You should assume that Winthrop Capital Management has a financial interest in one or more of the positions discussed. Past performance is not a guide to future performance, future returns are not guaranteed, and a loss of original capital may occur. Winthrop Capital Management has no obligation to provide recipients hereof with updates or changes to such data.