The Economy
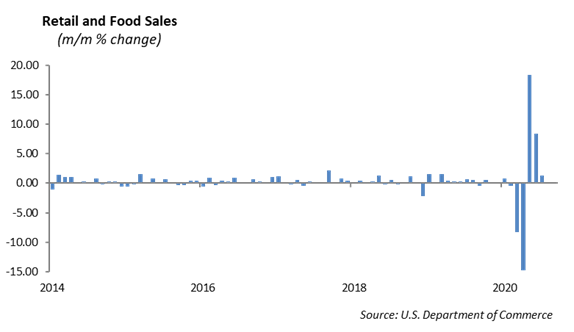
We are at a critical point of inflection in the economy. As government support for unemployed workers dries up, will the consumer sector hold up in August? The government assistance provided through the Cares Act was effective in helping small businesses and consumers stay afloat. The data for June and July shows the consumer was active, as retail sales increased 8.4% and 1.2% respectively. With over 15 million people unemployed, the $600 per week was welcome support.
However, the $600 benefit expired on July 25th. President Trump signed an executive order that will provide $300 per week unemployment benefit to qualified workers retroactive to August 1st. However, it is still several weeks away from being implemented. At the same time, the transition of students back to school is bumpy, with some schools participating in-class and others operating remotely. College football is at a fraction of its potential. We are still prohibited from gathering in restaurants, sporting events and concerts without social distancing. There are significant parts of the economy struggling, and we estimate that nearly $2 trillion in economic activity is currently shut down. With the record level of unemployment, the economic recovery cannot be sustained without government assistance. We expect the back-to-school season for retailers to be a huge bust. In addition, we expect the reduction in weekly unemployment benefits to negatively impact rent payments and the commercial real estate market.
In many cases, the coronavirus has accelerated the demise of companies operating with outdated business models and a shift in aggregate demand. Brick-and-mortar retail has been struggling for years leading up to the pandemic. Now, only companies with effective web-based strategies, such as Walmart and Target, are thriving.
We have maintained that the labor market is one of the key factors in building a sustained economic recovery. Last week, the Labor Department reported an increase in jobless claims to 1.1 million people filing for unemployment. This increase suggests that the economy is not producing jobs at a sustainable rate to put the 16 million unemployed back to work. With an unemployment rate at 10.2%, and a large part of the economy not functioning, our base case remains at a long, slow recovery that will not gain traction until 2021.
Equity
As the S&P 500 and NASDAQ reached new highs last week, the number of companies trading at their 52 week high is declining. The rally in the S&P 500 is concentrated in a relatively small number of companies. Microsoft, Amazon, Alphabet, Apple and Facebook, which represent 20% of the market cap of the Index, combined rose nearly 37% so far this year. The remaining stocks in the S&P 500 declined by roughly -6%. The heightened concentration in the S&P 500 in a few technology based companies increases the level of risk of a rotation when the economy eventually normalizes.
At the same time, the market value of Apple increased to $2 trillion last week. It took nearly 42 years for the company to reach $1 trillion in value, and just over two years to double to $2 trillion, making it the first company to reach the landmark.
The number of companies beating estimates have continued as this unusual earnings season winds down. Approximately 82% of companies have beat expectations. Looking at sectors, Technology has the highest beat rate at 87%. Most sectors fell within a 70-80% beat range. Real Estate and Energy were the weakest, both near 50%. Last week, we saw a strong quarter out of Target.
Target Corporation (TGT)
Target reported earnings of $3.38 vs. $1.62 expected, exceeding expectations. Revenue of $23 billion beat by estimates by $3 billion. Same store sales were up 24.3% vs 7.6%, which is an all-time high. Curbside pickup sales saw 700% growth. In addition, TGT reported 10 million new digital customers underscoring the success of their digital platform. Traffic was higher, and sales were up across all five merchandise categories. The strongest sales was in electronics, up 70% with home office items and video games picking up. The home category was up 30%, beauty was up 20%, and food and beverage were up 20%. Target’s online delivery service, Shipt, grew 350% year over year. Shares rose by over 10% to $153. Year to date, TGT stock is up 20%.
Portfolio Models
In our models, we have added a sleeve of the Invesco S&P 500 Equal Weight ETF (RSP). Currently, the S&P 500 is extremely concentrated, with the top five stocks representing over 20% of the Index. We estimate that roughly 40% of the total Index is essentially weighted to the Technology sector, if we include tech companies that were relocated to other S&P sectors such as Amazon, Google, Netflix, and Facebook. Eventually, we expect a shift in the market as the economy recovers, and performance in the COVID affected companies to accelerate. An ETF like RSP equal weights the companies that make up the S&P and allows us to increase exposure to industries heavily effected by COVID. The ETF is down about 6% year-to-date compared to a 5% gain in the S&P. This investment is a play on the recovery of those industries.
Fixed Income
Interest rates saw a reversal last week as interest rates declined and the curve shifted downwards. The shift was most prominent in longer dated 10+ years government notes. The catalyst for the downward flattening of the yield curve was the perception of slower economic growth due to weekly initial jobless claims rising back above 1 million after two consecutive weekly declines. However, positive housing and homebuilder data mitigated some of the downward pressure.
With interest rates declining, the investment grade credit indices experienced minor spread widening across the different rating tiers. All investment grade rating tranches were wider by a relatively insignificant 2 bps. High yield saw spread tightening as investors shifted to pick up in yield. The Bloomberg Barclays U.S. High Yield Index currently has a yield above 5.5% compared to the Bloomberg Barclays U.S. Credit Index yield under 2%.
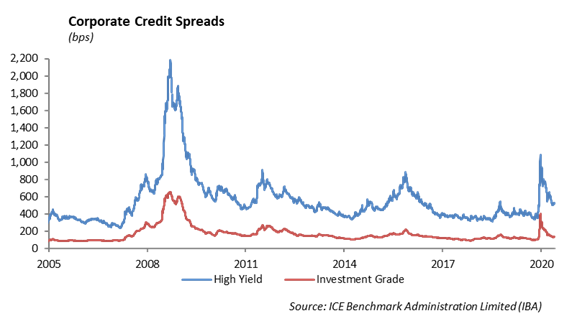
The current conversation among many institutional investors has been the prospect of a sector shift due to shifting performance expectations. The market has begun to show price improvement in COVID-19 affected sectors. Year-to-date, the higher-quality tranches of investment grade and high yield (AAA/AA in the IG index and BB in the HY index) have been the major outperformers. In the month of August, however, BBBs have been the winner in investment grade indices, and CCCs have outperformed the high yield index, despite a recent spread widening environment in high yield. This suggests a rotation back into risk sectors as the higher-quality ratings appear to be over bought.
The primary market in both investment grade and high yield markets remains robust, as companies that are able to access the public credit markets with historically low interest rates and tight credit spreads continue to do so. Investment grade supply hit two milestones in August as the $120 billion of new issuance broke August records, and the $1.36 trillion of year-to-date issuance exceeded record issuance set in 2017. Companies appear to be jumping at the chance to refinance short-term debt with historically low interest rates. A significant portion of new issues are tender driven, both in companies with well managed balanced sheets and more distressed companies. Despite the increase in new issue supply, the tender offers have partially offset the increased amount of total debt in the fixed income markets.
The Energy sector has remained relatively quiet. Prices for WTI crude oil have stabilized at $42.34 a barrel. OPEC+ commentary has been quiet as the current declines in inventories and concerns on COVID-19 recovery have offset each other leading to no policy changes. Natural gas prices have risen with a decline in supply and the winter season starting to approach.
This report is published solely for informational purposes and is not to be construed as specific tax, legal or investment advice. Views should not be considered a recommendation to buy or sell nor should they be relied upon as investment advice. It does not constitute a personal recommendation or take into account the particular investment objectives, financial situations, or needs of individual investors. Information contained in this report is current as of the date of publication and has been obtained from third party sources believed to be reliable. WCM does not warrant or make any representation regarding the use or results of the information contained herein in terms of its correctness, accuracy, timeliness, reliability, or otherwise, and does not accept any responsibility for any loss or damage that results from its use. You should assume that Winthrop Capital Management has a financial interest in one or more of the positions discussed. Past performance is not a guide to future performance, future returns are not guaranteed, and a loss of original capital may occur. Winthrop Capital Management has no obligation to provide recipients hereof with updates or changes to such data.