Monetary Policy
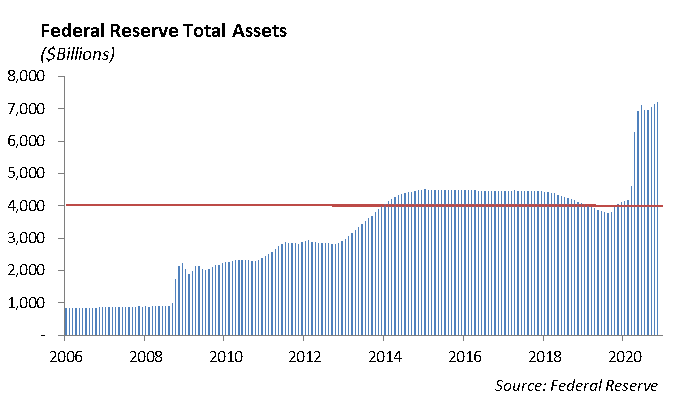
During the Financial Crisis in 2009, the Federal Reserve initiated an aggressive policy of purchasing bonds in the open market onto its balance sheet. Up to that point, the Federal Reserve had a constrained bond portfolio, which as a percentage of the Federal Reserve’s capital, represented roughly a 4.5% capital ratio. Following the Financial Crisis, the Fed maintained the portfolio and allowed it to decline to the point where the bond portfolio stood at $3.65 trillion, roughly 1.0% capital ratio, by the end of December 2019. Of the $22.8 trillion in U.S. Treasury obligations outstanding at year-end 2019, $3.4 trillion were held by foreign central banks.
In response to the pandemic and in efforts to keep the economy moving, the Federal Reserve ramped up its open market purchases of debt, building its bond portfolio to $7.18 trillion as of November 18th. In addition to purchasing Treasury securities and other U.S. obligations, the Federal Reserve expanded its purchases to include corporate securities. The bond portfolio of the Fed now represents 0.5% of the Fed’s capital. At the same time, U.S. debt has increased to $26.9 trillion by September 2020, yet foreign central bank holdings of Treasury obligations remain at $3.4 trillion. The Federal Reserve is the marginal buyer of U.S. Treasury debt, supporting the financing of the U.S. government and helping to create the expanded money supply. This represents a whole new monetary regime that extends beyond targeting the Fed funds rate to control the rate of expected inflation and further employment growth.
Equity
The DOW was up 1% last week, pushing the index to a record close of 30218 with year-to-date performance at 6%. The S&P continues its rally, rising 1.7% last week to end at an all-time high of 3699. After a few quiet weeks, the NASDAQ has also come to life, rising over 2% last week. The index is now at an all-time high of 12464, an increase of 39% year-to-date. The Russell 2000 is up 13% year-to-date and is at all-time highs.
The ISM Manufacturing Index fell to 57.5 in November, but it is coming off of its two-year high in October and signaling that the manufacturing sector is still in expansion mode. Increased demand combined with low inventories has kept manufacturing output at high levels and supported a rise in revenue of industrial companies. In turn, the improved fundamentals have lifted stock prices and highlighted the recovery trade as many of the laggards in the industrial sector, including Lockheed Martin, Honeywell, and General Electric, are setting new highs every week.
In company news, Salesforce announced the acquisition of Slack for just under $28 billion, which is a 40% premium from where the company was previously trading. Microsoft’s success with Microsoft Teams service pushed Salesforce to make a move into this space. Teams’ users have increased to 115 million from April, and with the success of Zoom this year, Salesforce was committed to joining this market. Although far behind both of these companies, Slack provides another way for Salesforce to expand. The company is now one of the highest-valued software companies in the world and constantly seeks growth catalysts. The move will cause near-term volatility due to a fairly high price tag and delayed integration of the software.
In IPO news, both Airbnb and DoorDash are expected to go public this month. Airbnb is now looking for an IPO price range of $56 to $60, giving the company a valuation of $42 billion, which is well over double the initial expectations from several months ago. DoorDash’s shares are priced in the $90 to $95 range. The combined companies will break the mark set for December IPO volume.
Fixed Income
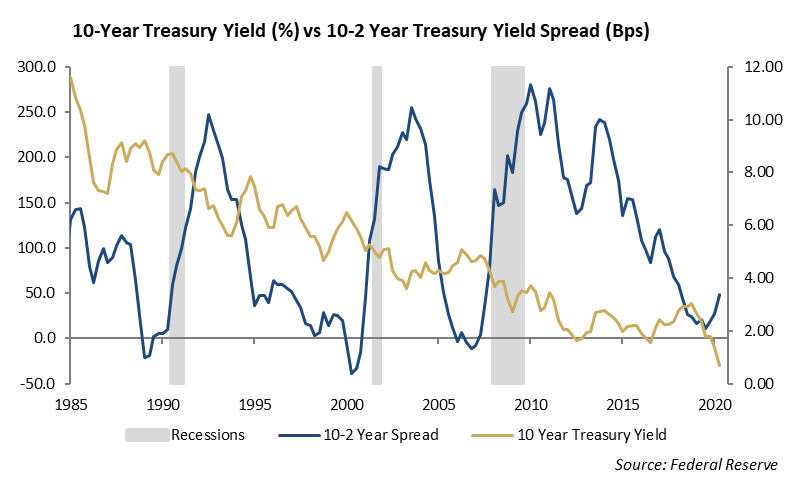
U.S. Treasury yields moved meaningfully higher over the prior week with the 10-year bond ending just shy of 1%. Yields have been slowly drifting higher since hitting all-time lows in August. With that said, we expect interest rates to move higher considering the viable vaccine candidates, a second round of stimulus on the horizon, and stocks trading at all-time highs. While risk assets across the board have recovered from the Covid sell-off, interest rates have not recovered to pre-Covid trading levels. At the beginning of the year, the 10-year U.S. Treasury was trading at a yield of 1.93%. We are currently far from that number, which may be a reflection that bond markets are more in sync with the global economy than with domestic stocks. We continue to believe that interest rates could increase in the near-term due to the potential for additional stimulus and a reopening economy; however, the natural, long-term level for rates is to remain low.
With the decline in the yield of the ten year U.S. Treasury this year, the slope of the yield curve has steepened. The Yield on the 10-year Treasury is now 73 basis points higher than the yield on the two year Treasury. As economic recovery prospects continue to improve we expect interest rates to move higher and the slop of the yield curve to continue to steepen.
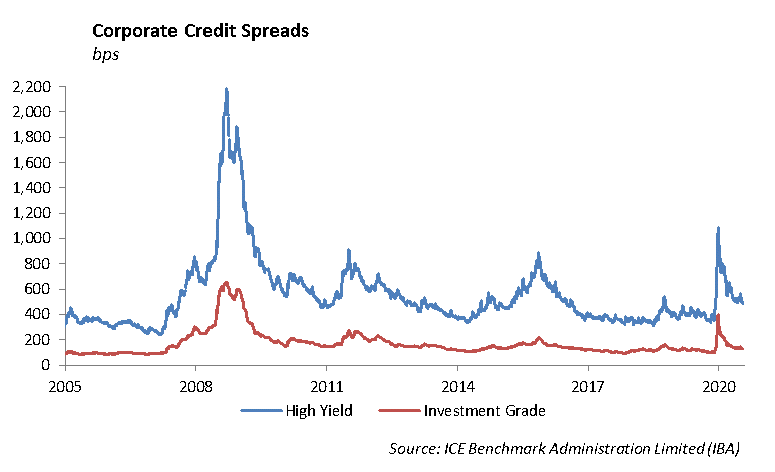
We expect that the upcoming week is set to be the final push of new issuance across fixed income markets for the year. Corporate, municipal, CLOs and CMBS are all set to have a heavy week of issuance before liquidity begins to leave the market. Credit spreads continue to tighten marginally, but they will likely pause with the amount of new issuance coming. Regardless, there seems to be little that will lead to a dislocation in the credit market right now. Despite increased defaults and low recovery rates, the fact that the Fed is there to support credit markets buoys investors to continue to buy. We continue to incrementally reduce idiosyncratic risks in our portfolios by reducing position sizing and increasing the number of positions. Near term, we believe credit spreads will continue to grind in after new issuance begins to fade from the market.
This report is published solely for informational purposes and is not to be construed as specific tax, legal or investment advice. Views should not be considered a recommendation to buy or sell nor should they be relied upon as investment advice. It does not constitute a personal recommendation or take into account the particular investment objectives, financial situations, or needs of individual investors. Information contained in this report is current as of the date of publication and has been obtained from third party sources believed to be reliable. WCM does not warrant or make any representation regarding the use or results of the information contained herein in terms of its correctness, accuracy, timeliness, reliability, or otherwise, and does not accept any responsibility for any loss or damage that results from its use. You should assume that Winthrop Capital Management has a financial interest in one or more of the positions discussed. Past performance is not a guide to future performance, future returns are not guaranteed, and a loss of original capital may occur. Winthrop Capital Management has no obligation to provide recipients hereof with updates or changes to such data.
© 2020 Winthrop Capital Management