The investment environment has changed dramatically from six months ago. After the S&P 500 peaked on December 26th , 2021 at 4766, we are now navigating a much different market environment with higher turbulence.
The economy is showing signs of slowing, the Federal Reserve is intent on raising short term interest rates to combat accelerating inflation, and the rate of inflation is forcing prices higher, putting pressure on corporate earnings and consumers’ wallets. At the same time, the capital markets are plagued by illiquidity, heightened volatility and a general lack of price transparency. There is a growing fear gripping markets and to investors, it can feel like there is no place safe to hide.
The questions we are being asked include – should I get out of the market and move everything to cash? Do you think the market is going to keep going lower?
However, the questions that should be asked are:
Whether I’m considering in a stock, a bond, or an index fund – is it trading at fair value? Or, are the securities that I am already currently invested in trading at fair value?
Reasonable Valuations
To address the question of fair value, let’s first address the domestic stock market. While the S&P 500 is trading near 4100, it has traded down to 3810, a dramatic decline of -20.0% from its peak. If we assume trailing twelve-month earnings of $205, the S&P 500 traded roughly 19.4 times earnings. If we assume a trailing twelve-month earnings number closer to $215, the current P/E is roughly 18.5 times earnings. Assuming a modest terminal rate of growth for earnings, we believe the equity market, measured by the S&P 500 is currently trading roughly at 17.5 times forward earnings.
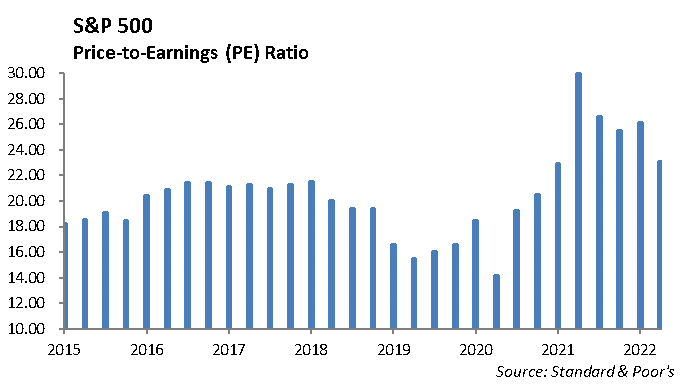
Compare that to last November. As of November 10, 2021, the S&P 500 was at 4641 and had trailing year P/E ratio of 26.4 and a forward P/E ratio (based on expected earnings in the next four quarters) of 22.9 times earnings.
Historically, fair value for the S&P 500 is around 17.1 times trailing earnings. In other words, at current earnings level of $205, the S&P 500 would need to trade at a level near 3505 to approach historic valuations. This represents a -11.8% decline from today’s level. Or, expected earnings on the S&P 500 would need to increase to $233 per share to achieve the same valuation. However, depending on your view on earnings, the S&P 500 is closer to fair value today then measures we have seen over the past two years.
The Bond Market Tells a Similar Story
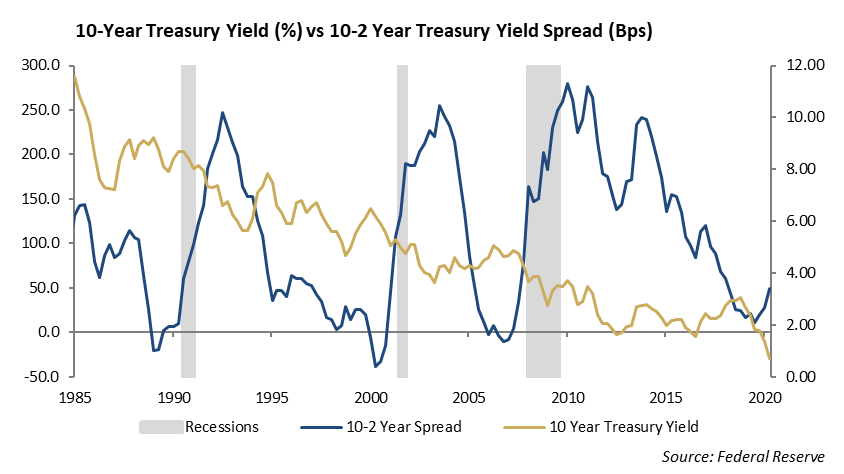
The yield on the ten-year U.S. Treasury has increased from 1.51% to 2.95% this year and we are currently trading at levels not seen since 2018. In addition, investment grade credit spreads have widened 50 -75 bps this year, which allows an intermediate duration high quality credit portfolio to easily earn a 4.5% yield.
Measures of valuation, including Capital Asset Pricing Models and the Taylor Rule, which involve adjusting a nominal base interest rate by adding an adjustment for inflation, have not been effective valuation measures since the Financial Crisis. Certain fixed income valuation measures are useful within specific inflation and monetary policy regimes. In today’s current monetary regime, we believe we are approaching fair value in fixed income.
Three Factors that Will Impact the Market
While our base case is that we will continue to experience elevated volatility through the summer, there are three reason the capital markets could settle down in the second half of the year and we may see some improvement in stock prices.
First, the rate of growth of the economy is slowing. Expectations for slower economic growth will help to reduce short term interest rates, particularly in the long end of the yield curve. This would take pressure off the Fed to continue to raise short term interest rates.
Second, for several reasons we expect the rate of inflation will decline in the second half of the year, but still remain above 4% year over year levels. These include improvement in global supply chain efficiencies, higher comparable level on a trailing twelve-month basis, and decreasing wage growth. Lower inflation expectations will help to reduce interest rates.
Third, we expect China to pump stimulus into its market. The size of China’s GDP is proportional to Europe’s GDP as a percent of total global economy at 20%. As China pushes stimulus through its economy, the global economy will feel the benefit as output increases and trade accelerates.
This report is published solely for informational purposes and is not to be construed as specific tax, legal or investment advice. Views should not be considered a recommendation to buy or sell nor should they be relied upon as investment advice. It does not constitute a personal recommendation or take into account the particular investment objectives, financial situations, or needs of individual investors. Information contained in this report is current as of the date of publication and has been obtained from third party sources believed to be reliable. WCM does not warrant or make any representation regarding the use or results of the information contained herein in terms of its correctness, accuracy, timeliness, reliability, or otherwise, and does not accept any responsibility for any loss or damage that results from its use. You should assume that Winthrop Capital Management has a financial interest in one or more of the positions discussed. Past performance is not a guide to future performance, future returns are not guaranteed, and a loss of original capital may occur. Winthrop Capital Management has no obligation to provide recipients hereof with updates or changes to such data.
© 2022 Winthrop Capital Management