Second Quarter 2026
The Inflection Point
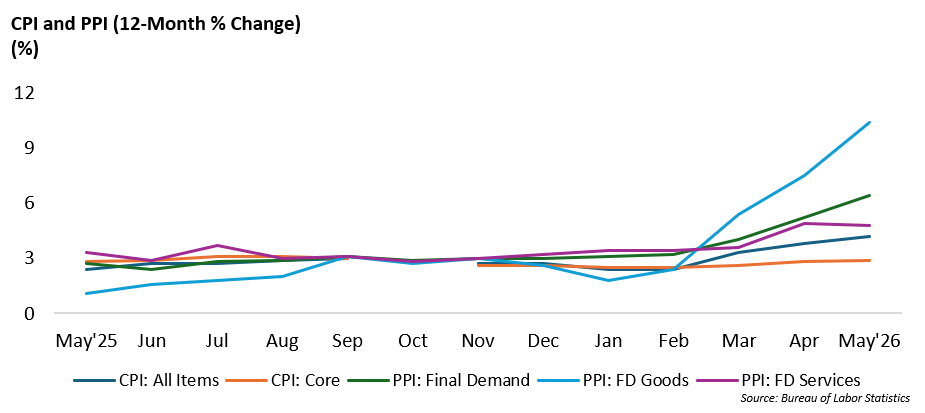
There is a growing divergence in the inflation data measured in the economy. Following the release of the May 2026 inflation reports, financial markets have been presented with a defining macroeconomic puzzle: a rapidly widening gap between the industrial output measured by the Producer Price Index (PPI) and consumption data measured by the Consumer Price Index (CPI). While consumer prices appear relatively contained outside of the energy sector, producer costs are accelerating aggressively. This divergence in inflation data has broad implications for investment strategies and asset valuations.
This expanded Economic & Capital Market Outlook dissects the mechanics behind this divergence—primarily driven by corporate margin absorption and upstream energy shocks. Furthermore, we broaden our analysis to project what this means for the overall U.S. economic outlook. The key question as we move into the second half of 2026 is whether businesses will continue to absorb these incremental higher costs, which risks earnings contracting, or begin to pass the costs onto consumers, which forces the Federal Reserve into a tighter monetary stance risking a consumer-led economic contraction.
The Inflation Divergence and the Transmission Channel
At first glance, the May inflation data appears contradictory. The CPI report indicated that inflation, outside of the energy sector, is relatively stable. Headline CPI rose +0.5% month-over-month (MoM) and +4.2% year-over-year (YoY). Core CPI, which strips out volatile food and energy, rose just +0.2%, anchored by cooling shelter costs (+0.3%).
However, the PPI report told a story of accelerating upstream pressures, with final demand jumping +1.1% MoM and +6.5% YoY.
This 2.3% YoY spread (6.5% vs. 4.2%) is the crucial transmission channel of the current economy. PPI captures prices received by producers, while CPI captures prices ultimately paid by consumers. The increased distance between the two represents an increase in pressure on corporate profit margins. Producers, including wholesalers, manufacturers, distributors, and retailers are facing accelerating input costs that they must decide whether to absorb higher costs or pass them on to the end customer.
Tracing the Shock Through the Supply Chain
To understand where this pressure is accumulating, we utilize the Bureau of Labor Statistics (BLS) production flow framework. The May PPI report revealed broad-based upstream pricing pressure that sequentially steps down as it approaches the consumer.
This sequential step-down below illustrates how inflationary pressure originating in raw materials becomes progressively absorbed as it travels downstream through the supply chain using oil as an example:
• Stage 1 (Raw Inputs): The start of the chain (e.g., crude oil extraction).
• Stage 2 (Primary Processing): Where refiners turn crude into usable materials and fuel.
• Stage 3 (Distribution): Freight and wholesale operators moving products downstream.
• Stage 4 (Retailers): The consumer-facing end putting finished goods on shelves

This data provides a textbook look at how an upstream cost shock gradually loses its velocity as businesses intermediate the flow to the consumer. Inflationary pressure is physically moving through supply chains rather than remaining isolated in commodity markets.
Energy Catalysts and the Corporate Margin Squeeze
Rising energy prices are the undeniable catalyst of this current upstream shock. Crude oil, gasoline, diesel, and transportation-related service costs all jumped significantly in May. The measure of PPI for final demand (as opposed to measures of intermediate demand) for energy alone rose +10.7% on the month. Because modern manufacturers, distributors, and retailers rely heavily on freight for transportation and logistics, rising fuel costs act as a broad-based tax that touches every industry and increases pricing pressure.
Yet, to this point, businesses have severely restricted how much of this energy price shock reaches the consumer.
The Costco Proxy: Fighting for Market Share
If producer energy costs are up 10.7% and consumer energy costs are up 3.9%, the divergence implies that businesses are eating the difference. Large retailers are protecting their value propositions and market share by absorbing cost increases and accepting thinner profit margins rather than risking reduced foot traffic with aggressive price hikes.
Costco (COST) serves as a vital proxy for this dynamic. Despite facing significantly higher transportation, distribution, and input costs, Costco’s most recent quarter showed gross margins down 21 basis points, with core merchandise margins down 46 basis points YoY. Even stripping out the volatile effects of gasoline sales, core merchandise margins were still down 29 basis points. Simultaneously, management highlighted multiple price cuts across their Kirkland brand. This indicates a strategic choice to lean into value and shoulder the inflation burden themselves, even as their own operating environment grows highly inflationary. We expect this margin pressure is creating headwinds for Costco’s next quarter’s earnings.
Overall Economic Outlook (H2 2026)
Broadening the lens beyond the immediate inflation prints, the PPI-CPI divergence serves as a leading indicator with important implications for the overall macroeconomic landscape as we move through the second half of 2026. The economy appears to be currently holding to a “steady state” for the time being, waiting to see how corporate shock absorbers will adjust to holding market share or improving profit margins.
1. Corporate Earnings: An Approaching Margin Recession
Consumers are currently experiencing a “muted” version of the impact of rising inflation, allowing retail spending to remain surprisingly resilient on the surface. However, this resilience is built on a fragile foundation. After years of cumulative inflation, household discretionary income budgets are tightening, and consumers have become increasingly price-sensitive. Retailers are acutely aware that if they abandon their margin-absorption strategies and push the elevated 6.5% PPI growth directly into higher consumer prices, and ultimately higher CPI, they will trigger an immediate and sharp pullback in discretionary spending. The exhausted consumer is acting as a natural ceiling on the pace of CPI.
2. Corporate Earnings: An Approaching Margin Recession
The corporate shock absorber cannot last indefinitely. If CPI continues to lag PPI, the inevitable mathematical result is widespread margin compression. We expect the upcoming Q2 and Q3 2026 earnings seasons to reflect this reality. Companies lacking significant pricing power, economies of scale, or robust competitive moats will see their profitability erode rapidly. We project that sustained elevated PPI pressure could ultimately reveal a broader “earnings recession,” particularly in the consumer discretionary and retail sectors.
3. The Labor Market Feedback Loop
When companies suffer prolonged margin compression that they do not pass on to the consumer, they inevitably turn to internal cost-cutting measures to defend earnings. This elevates the risk that corporate America will institute hiring freezes, reduce weekly hours worked, and initiate targeted layoffs by late 2026. The current corporate margin squeeze is a leading indicator for softening labor demand.
4. Federal Reserve Policy: The “Higher for Longer” Trap
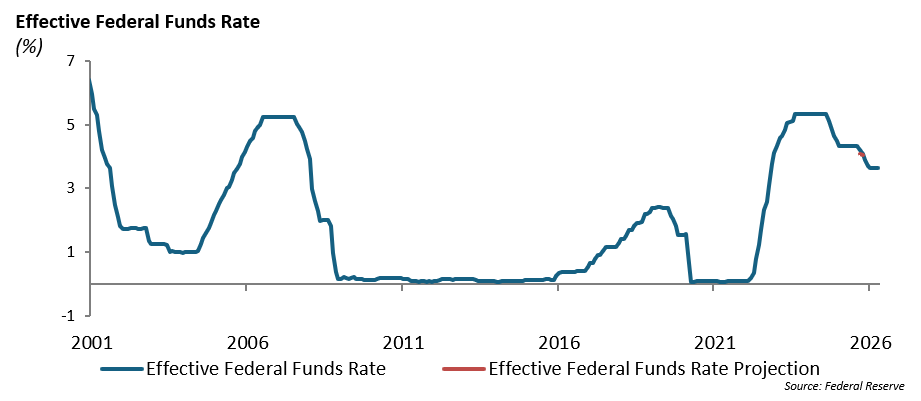
The divergence between CPI and PPI potentially creates a highly complex stagflationary dilemma for the Federal Reserve board and Chairman Warsh beginning his new term.
- The Dovish Pull: A Core CPI reading of +0.2% MoM with moderating shelter inflation (+0.3%) gives the Fed exactly what it wants—a localized, contained consumer inflation narrative.
- The Hawkish Pull: A +6.5% YoY PPI acts as a massive pipeline of latent inflation pressure. If the Fed cuts interest rates prematurely, it risks reigniting consumer demand. This would give corporations the pricing power to finally pass those upstream costs onto consumers, triggering a secondary wave of headline inflation.
Base Case: Considering the Fed’s dual mandate of price stability and employment, we believe the Fed’s focus has shifted this year from the labor market to inflation. We anticipate the Fed will maintain a cautious “hawkish hold” pattern throughout Q3 and Q4. We believe the current inflation data prevents them from justifying aggressive rate cuts. The Fed is effectively forced to hold conditions restrictive in an effort to crush upstream demand before it fully spills over into the consumer basket. However, a softening labor market in the second half of the year could further complicate the Fed’s interest rate policy.
Strategic Asset Allocation
How long this divergence between CPI and PPI lasts depends entirely on corporate stamina. For investors, today’s increase in PPI could become tomorrow’s CPI, or it could become tomorrow’s earnings miss if companies choose to continue to absorb rising input costs. In this bifurcated environment, we recommend the following strategic portfolio positioning:
- Overweight “Quality” and Pricing Power: In an era of margin compression, screen for mega-cap equities with fortress balance sheets, gross margins well above industry averages, and inelastic demand profiles (e.g., essential Healthcare, Consumer Staples). Pricing power is the ultimate defensive moat which provides protection for sustainable profit margins.
- Overweight Upstream Sectors & Commodities: Energy producers, industrials, and raw material extractors (Stages 1 & 2 of the supply chain) offer a natural hedge against the current cost shock, capitalizing on the pricing power residing at the top of the supply chain.
- Underweight Highly Competitive Retail: Avoid Stage 4 retail and highly leveraged consumer discretionary names that lack the scale, deep pockets, and pricing power required to survive a protracted margin-compression cycle. This sector is also vulnerable to pull back in consumer spending in the second half of the year.
- Fixed Income (Overweight Short Duration): With the Fed trapped in a “higher for longer” holding pattern by the 6.5% PPI, short-duration Treasury bills and high-quality short-term corporate bonds continue to offer highly attractive, risk-adjusted yields while avoiding the term-premium volatility of long-duration bonds.
Conclusion
The inflation narrative for 2026 has evolved from a simple story of marginal price increases to a more complicated story involving corporate strategic decisions to either maintain market share or maintain profit margins, which have profound implications for investors. The transmission channel between producer costs and consumer prices is currently clogged by fierce retail competition and growing consumer exhaustion. Over the next six months, the ultimate health of the U.S. economy will not be measured strictly by CPI prints as a reflection of the rate of inflation, but by the resilience of corporate profit margins in the face of elevated input costs. Whether this dynamic resolves itself through a resurgence in consumer inflation or a wave of corporate cost-cutting, the economic trajectory of late 2026 will be significantly impacted. This impact is further complicated if there is softening in the labor market over the second half of the year.
This report is published solely for informational purposes and is not to be construed as specific tax, legal or investment advice. Views should not be considered a recommendation to buy or sell nor should they be relied upon as investment advice. It does not constitute a personal recommendation or take into account the particular investment objectives, financial situations, or needs of individual investors. Information contained in this report is current as of the date of publication and has been obtained from third party sources believed to be reliable. WCM does not warrant or make any representation regarding the use or results of the information contained herein in terms of its correctness, accuracy, timeliness, reliability, or otherwise, and does not accept any responsibility for any loss or damage that results from its use. You should assume that Winthrop Capital Management has a financial interest in one or more of the positions discussed. Past performance is not a guide to future performance, future returns are not guaranteed, and a loss of original capital may occur. Winthrop Capital Management has no obligation to provide recipients hereof with updates or changes to such data.
© 2026 Winthrop Capital Management